QuickPlot: Quick and easy data visualization with Haskell


Flags
Automatic Flags
| Name | Description | Default |
|---|---|---|
| buildexamples | Build example executables | Disabled |
Use -f <flag> to enable a flag, or -f -<flag> to disable that flag. More info
Downloads
- QuickPlot-0.1.0.1.tar.gz [browse] (Cabal source package)
- Package description (revised from the package)
Note: This package has metadata revisions in the cabal description newer than included in the tarball. To unpack the package including the revisions, use 'cabal get'.
Maintainer's Corner
For package maintainers and hackage trustees
Candidates
- No Candidates
| Versions [RSS] | 0.1.0.0, 0.1.0.1 |
|---|---|
| Dependencies | aeson (>=0.9.0.1 && <0.11), attoparsec (>=0.13.0.1), base (>=4.7 && <5), bytestring (>=0.10.6), haskell-src-meta (>=0.6.0.13), parsec (>=3.1.9), QuickPlot, scientific (>=0.3.4.4), snap (>=0.14.0.6), snap-core (>=0.9.8), template-haskell (>=2.10), text (>=1.2.2), vector (>=0.11), websockets (>=0.9.6.1), websockets-snap (>=0.9.2) [details] |
| License | GPL-3.0-only |
| Author | tepf |
| Maintainer | tepf@tutanota.com |
| Uploaded | by tepf at 2016-02-15T09:53:41Z |
| Revised | Revision 1 made by HerbertValerioRiedel at 2018-09-01T22:36:57Z |
| Category | Graphics |
| Home page | http://github.com/tepf/QuickPlot#readme |
| Source repo | head: git clone https://github.com/tepf/QuickPlot.git |
| Distributions | |
| Reverse Dependencies | 1 direct, 0 indirect [details] |
| Executables | BasicPlotting |
| Downloads | 2038 total (3 in the last 30 days) |
| Rating | (no votes yet) [estimated by Bayesian average] |
| Your Rating | |
| Status | Docs available [build log] Last success reported on 2016-02-15 [all 1 reports] |
Readme for QuickPlot-0.1.0.1
[back to package description]QuickPlot
How does it work?
Haskell creates a simple server that runs in the background and sends data to a browser that visualizes it. In the demo above the browser and ghci runs inside Atom, but you can use any editor (even butterflies) with a fairly modern browser. Once the data arrives at the browser any JavaScript visualization library could take care of it like for example plot.ly
How do I use it?
QuickPlot was designed to make interactive data exploration easier. So the following won't make much sense outside of ghci
0. Install QuickPlot
stack install QuickPlot
cabal install QuickPlot
-- or manually
1. Import QuickPlot
import QuickPlot
import QuickPlot.Plotly -- if you want to use the plotly library
2. Start QuickPlot
runQuickPlot
3. Connect to QuickPlot
Go to the address runQuickPlot printed
4. Plot
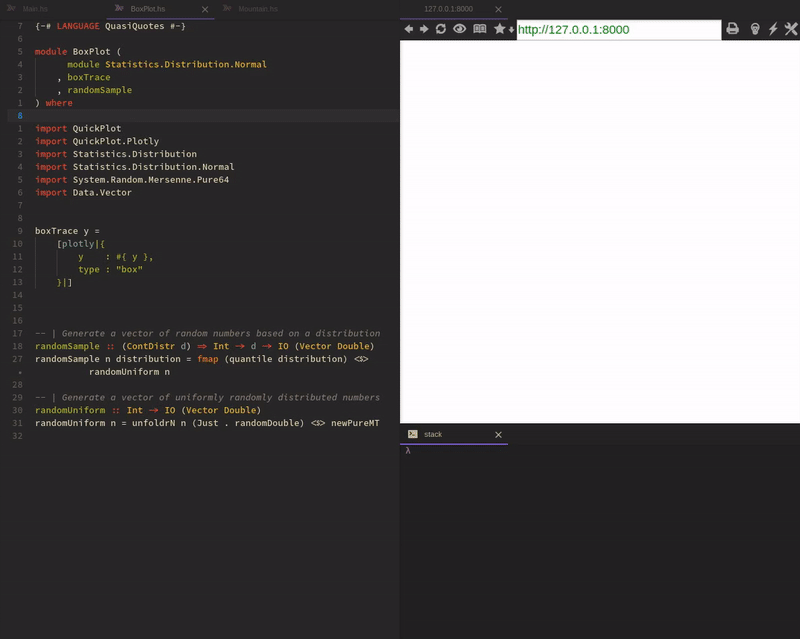
Here is the less verbose version of the full example:
-- As box aficionados we just measured the weight of all our boxes at home
-- and gathered the following data
blueBoxSizes   = [1.1, 1.8, 2.9, 3.3] :: [Double]
orangeBoxSizes = [3.1, 3.8, 5.9, 2.3] :: [Double]

-- We create traces from our data
blueBoxTrace = [plotly|{
      y    : #{ blueBoxSizes },
      type : "box"
}|]
orangeBoxTrace = [plotly|{
      y    : #{ orangeBoxSizes },
      type : "box"
}|]

-- And finally gain great insight from the data visualization
plot [blueBoxTrace, orangeBoxTrace]
FAQ
Does it work on X?
Probably yes. If your browser supports WebSockets, HTML5, CSS3 you'll be fine. If not please update your browser. Find out more about here
Can you implement library X?
If the library takes JSON as an input, submit an issue. Libraries like D3.js are problematic however. Graphs in D3 are created programatically and therefore you can't just pick a graph type and say plot it. You have to create them from scratch. If there are examples that give you goosebumps it is possible to integrate them separately. Or you just include it as a user script yourself (once this is implemented)
How can I help?
There are many ways to do so:
- If you know JavaScript/HTML/CSS you could make the UI prettier, more user friendly or easier extensible
- Implement a visualization library in JavaScript
Can this library only use JavaScript libraries?
Technically any library that Haskell can convice to create graphics is compatible.