| Copyright | (c) Douglas Burke 2018-2019 |
|---|---|
| License | BSD3 |
| Maintainer | dburke.gw@gmail.com |
| Stability | unstable |
| Portability | OverloadedStrings, TupleSections |
| Safe Haskell | None |
| Language | Haskell2010 |
Graphics.Vega.VegaLite
Contents
Description
This is essentially a straight port of the Elm Vega Lite module (version 2.2.1). It allows users to create a Vega-Lite specification, targeting version 2 of the JSON schema. The ihaskell-hvega module provides an easy way to embed Vega-Lite visualizations in an IHaskell notebook (using Vega-Embed).
The major change to version 2.2.1 of the Elm version is that the type representing
the full Vega-Lite specification - that is, the return value of
toVegaLite - is not a VLSpec (an alias for Value)
but is instead a newtype around this (VegaLite). There are also some minor
changes to the exported types and symbols (e.g. Utc is exported rather than
utc and bin is not exported).
Note that this module exports several symbols that are exported
by the Prelude, namely filter, lookup,
and repeat; to avoid name clashes it's therefore advised
to either import the module qualified, for example:
import qualified Graphics.Vega.VegaLite as VL
or to hide the clashing names explicitly:
import Prelude hiding (filter, lookup)
In the following example, we'll assume the latter.
Example
Let's say we have the following plot declaration in a module:
{-# language OverloadedStrings #-}
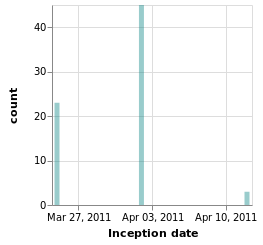
vl1 = toVegaLite [description desc, background "white", dat [], mark Bar barOpts, enc []] where
desc = "A very exciting bar chart"
dat = dataFromRows [Parse [("start", FoDate "%Y-%m-%d")]]
. dataRow [("start", Str "2011-03-25"), ("count", Number 23)]
. dataRow [("start", Str "2011-04-02"), ("count", Number 45)]
. dataRow [("start", Str "2011-04-12"), ("count", Number 3)]
barOpts = [MOpacity 0.4, MColor "teal"]
enc = encoding
. position X [PName "start", PmType Temporal, PAxis [AxTitle "Inception date"]]
. position Y [PName "count", PmType Quantitative]
We can inspect how the encoded JSON looks like in an GHCi session:
>encode$fromVLvl1 > "{"mark":{"color":"teal","opacity":0.4,"type":"bar"},"data":{"values":[{"start":"2011-03-25","count":23},{"start":"2011-04-02","count":45},{"start":"2011-04-12","count":3}],"format":{"parse":{"start":"date:'%Y-%m-%d'"}}},"$schema":"https:/vega.github.ioschemavega-litev2.json","encoding":{"x":{"field":"start","type":"temporal","axis":{"title":"Inception date"}},"y":{"field":"count","type":"quantitative"}},"background":"white","description":"A very exciting bar chart"}"
The produced JSON can then be processed with vega-lite, which renders the following image :
Synopsis
- toVegaLite :: [(VLProperty, VLSpec)] -> VegaLite
- fromVL :: VegaLite -> VLSpec
- data VLProperty
- type VLSpec = Value
- data VegaLite
- type LabelledSpec = (Text, VLSpec)
- type BuildLabelledSpecs = [LabelledSpec] -> [LabelledSpec]
- combineSpecs :: [LabelledSpec] -> VLSpec
- toHtml :: VegaLite -> Text
- toHtmlFile :: FilePath -> VegaLite -> IO ()
- dataFromUrl :: Text -> [Format] -> Data
- dataFromColumns :: [Format] -> [DataColumn] -> Data
- dataFromRows :: [Format] -> [DataRow] -> Data
- dataFromJson :: VLSpec -> [Format] -> Data
- dataFromSource :: Text -> [Format] -> Data
- datasets :: [(Text, Data)] -> Data
- dataColumn :: Text -> DataValues -> [DataColumn] -> [DataColumn]
- dataRow :: [(Text, DataValue)] -> [DataRow] -> [DataRow]
- geometry :: Geometry -> [(Text, DataValue)] -> VLSpec
- geoFeatureCollection :: [VLSpec] -> VLSpec
- geometryCollection :: [VLSpec] -> VLSpec
- type Data = (VLProperty, VLSpec)
- type DataColumn = [LabelledSpec]
- type DataRow = VLSpec
- data Format
- data Geometry
- data DataType
- transform :: [LabelledSpec] -> (VLProperty, VLSpec)
- projection :: [ProjectionProperty] -> (VLProperty, VLSpec)
- data ProjectionProperty
- data Projection
- data ClipRect
- aggregate :: [VLSpec] -> [Text] -> BuildLabelledSpecs
- data Operation
- opAs :: Operation -> Text -> Text -> VLSpec
- timeUnitAs :: TimeUnit -> Text -> Text -> BuildLabelledSpecs
- binAs :: [BinProperty] -> Text -> Text -> BuildLabelledSpecs
- data BinProperty
- calculateAs :: Text -> Text -> BuildLabelledSpecs
- filter :: Filter -> BuildLabelledSpecs
- data Filter
- data FilterRange
- lookup :: Text -> Data -> Text -> [Text] -> BuildLabelledSpecs
- lookupAs :: Text -> Data -> Text -> Text -> BuildLabelledSpecs
- mark :: Mark -> [MarkProperty] -> (VLProperty, VLSpec)
- data Mark
- data MarkProperty
- = MAlign HAlign
- | MAngle Double
- | MBandSize Double
- | MBaseline VAlign
- | MBinSpacing Double
- | MClip Bool
- | MColor Text
- | MCursor Cursor
- | MContinuousBandSize Double
- | MDiscreteBandSize Double
- | MdX Double
- | MdY Double
- | MFill Text
- | MFilled Bool
- | MFillOpacity Double
- | MFont Text
- | MFontSize Double
- | MFontStyle Text
- | MFontWeight FontWeight
- | MInterpolate MarkInterpolation
- | MOpacity Double
- | MOrient MarkOrientation
- | MRadius Double
- | MShape Symbol
- | MShortTimeLabels Bool
- | MSize Double
- | MStroke Text
- | MStrokeDash [Double]
- | MStrokeDashOffset Double
- | MStrokeOpacity Double
- | MStrokeWidth Double
- | MStyle [Text]
- | MTension Double
- | MText Text
- | MTheta Double
- | MThickness Double
- data MarkOrientation
- data MarkInterpolation
- data Symbol
- = SymCircle
- | SymSquare
- | Cross
- | Diamond
- | TriangleUp
- | TriangleDown
- | Path Text
- data Cursor
- = CAuto
- | CDefault
- | CNone
- | CContextMenu
- | CHelp
- | CPointer
- | CProgress
- | CWait
- | CCell
- | CCrosshair
- | CText
- | CVerticalText
- | CAlias
- | CCopy
- | CMove
- | CNoDrop
- | CNotAllowed
- | CAllScroll
- | CColResize
- | CRowResize
- | CNResize
- | CEResize
- | CSResize
- | CWResize
- | CNEResize
- | CNWResize
- | CSEResize
- | CSWResize
- | CEWResize
- | CNSResize
- | CNESWResize
- | CNWSEResize
- | CZoomIn
- | CZoomOut
- | CGrab
- | CGrabbing
- encoding :: [LabelledSpec] -> (VLProperty, VLSpec)
- data Measurement
- position :: Position -> [PositionChannel] -> BuildLabelledSpecs
- data PositionChannel
- data Position
- data SortProperty
- data StackProperty
- = StZero
- | StNormalize
- | StCenter
- | NoStack
- data AxisProperty
- = AxDomain Bool
- | AxFormat Text
- | AxGrid Bool
- | AxLabelAngle Double
- | AxLabelOverlap OverlapStrategy
- | AxLabelPadding Double
- | AxLabels Bool
- | AxMaxExtent Double
- | AxMinExtent Double
- | AxOffset Double
- | AxOrient Side
- | AxPosition Double
- | AxTicks Bool
- | AxTickCount Int
- | AxTickSize Double
- | AxTitle Text
- | AxTitleAlign HAlign
- | AxTitleAngle Double
- | AxTitleMaxLength Double
- | AxTitlePadding Double
- | AxValues [Double]
- | AxDates [[DateTime]]
- | AxZIndex Int
- data OverlapStrategy
- data Side
- data HAlign
- data VAlign
- data FontWeight
- data TimeUnit
- = Year
- | YearQuarter
- | YearQuarterMonth
- | YearMonth
- | YearMonthDate
- | YearMonthDateHours
- | YearMonthDateHoursMinutes
- | YearMonthDateHoursMinutesSeconds
- | Quarter
- | QuarterMonth
- | Month
- | MonthDate
- | Date
- | Day
- | Hours
- | HoursMinutes
- | HoursMinutesSeconds
- | Minutes
- | MinutesSeconds
- | Seconds
- | SecondsMilliseconds
- | Milliseconds
- | Utc TimeUnit
- size :: [MarkChannel] -> BuildLabelledSpecs
- color :: [MarkChannel] -> BuildLabelledSpecs
- fill :: [MarkChannel] -> BuildLabelledSpecs
- stroke :: [MarkChannel] -> BuildLabelledSpecs
- opacity :: [MarkChannel] -> BuildLabelledSpecs
- shape :: [MarkChannel] -> BuildLabelledSpecs
- data MarkChannel
- = MName Text
- | MRepeat Arrangement
- | MmType Measurement
- | MScale [ScaleProperty]
- | MBin [BinProperty]
- | MTimeUnit TimeUnit
- | MAggregate Operation
- | MLegend [LegendProperty]
- | MSelectionCondition BooleanOp [MarkChannel] [MarkChannel]
- | MDataCondition BooleanOp [MarkChannel] [MarkChannel]
- | MPath Text
- | MNumber Double
- | MString Text
- | MBoolean Bool
- data LegendProperty
- data Legend
- data LegendOrientation
- data LegendValues
- text :: [TextChannel] -> BuildLabelledSpecs
- tooltip :: [TextChannel] -> BuildLabelledSpecs
- data TextChannel
- hyperlink :: [HyperlinkChannel] -> BuildLabelledSpecs
- data HyperlinkChannel
- order :: [OrderChannel] -> BuildLabelledSpecs
- data OrderChannel
- row :: [FacetChannel] -> BuildLabelledSpecs
- column :: [FacetChannel] -> BuildLabelledSpecs
- detail :: [DetailChannel] -> BuildLabelledSpecs
- data DetailChannel
- data ScaleProperty
- data Scale
- = ScLinear
- | ScPow
- | ScSqrt
- | ScLog
- | ScTime
- | ScUtc
- | ScSequential
- | ScOrdinal
- | ScBand
- | ScPoint
- | ScBinLinear
- | ScBinOrdinal
- categoricalDomainMap :: [(Text, Text)] -> [ScaleProperty]
- domainRangeMap :: (Double, Text) -> (Double, Text) -> [ScaleProperty]
- data ScaleDomain
- = DNumbers [Double]
- | DStrings [Text]
- | DDateTimes [[DateTime]]
- | DSelection Text
- | Unaggregated
- data ScaleRange
- data ScaleNice
- data CInterpolate
- layer :: [VLSpec] -> (VLProperty, VLSpec)
- hConcat :: [VLSpec] -> (VLProperty, VLSpec)
- vConcat :: [VLSpec] -> (VLProperty, VLSpec)
- resolve :: [LabelledSpec] -> (VLProperty, VLSpec)
- resolution :: Resolve -> BuildLabelledSpecs
- data Resolve
- = RAxis [(Channel, Resolution)]
- | RLegend [(Channel, Resolution)]
- | RScale [(Channel, Resolution)]
- data Channel
- data Resolution
- repeat :: [RepeatFields] -> (VLProperty, VLSpec)
- data RepeatFields
- = RowFields [Text]
- | ColumnFields [Text]
- facet :: [FacetMapping] -> (VLProperty, VLSpec)
- data FacetMapping
- = ColumnBy [FacetChannel]
- | RowBy [FacetChannel]
- data FacetChannel
- asSpec :: [(VLProperty, VLSpec)] -> VLSpec
- specification :: VLSpec -> (VLProperty, VLSpec)
- data Arrangement
- data HeaderProperty
- selection :: [LabelledSpec] -> (VLProperty, VLSpec)
- select :: Text -> Selection -> [SelectionProperty] -> BuildLabelledSpecs
- data Selection
- data SelectionProperty
- data Binding
- = IRange Text [InputProperty]
- | ICheckbox Text [InputProperty]
- | IRadio Text [InputProperty]
- | ISelect Text [InputProperty]
- | IText Text [InputProperty]
- | INumber Text [InputProperty]
- | IDate Text [InputProperty]
- | ITime Text [InputProperty]
- | IMonth Text [InputProperty]
- | IWeek Text [InputProperty]
- | IDateTimeLocal Text [InputProperty]
- | ITel Text [InputProperty]
- | IColor Text [InputProperty]
- data InputProperty
- data SelectionResolution
- = Global
- | Union
- | Intersection
- data SelectionMarkProperty
- data BooleanOp
- name :: Text -> (VLProperty, VLSpec)
- title :: Text -> (VLProperty, VLSpec)
- description :: Text -> (VLProperty, VLSpec)
- height :: Double -> (VLProperty, VLSpec)
- width :: Double -> (VLProperty, VLSpec)
- padding :: Padding -> (VLProperty, VLSpec)
- autosize :: [Autosize] -> (VLProperty, VLSpec)
- background :: Text -> (VLProperty, VLSpec)
- configure :: [LabelledSpec] -> (VLProperty, VLSpec)
- configuration :: ConfigurationProperty -> BuildLabelledSpecs
- data ConfigurationProperty
- = AreaStyle [MarkProperty]
- | Autosize [Autosize]
- | Axis [AxisConfig]
- | AxisX [AxisConfig]
- | AxisY [AxisConfig]
- | AxisLeft [AxisConfig]
- | AxisRight [AxisConfig]
- | AxisTop [AxisConfig]
- | AxisBottom [AxisConfig]
- | AxisBand [AxisConfig]
- | Background Text
- | BarStyle [MarkProperty]
- | CircleStyle [MarkProperty]
- | CountTitle Text
- | FieldTitle FieldTitleProperty
- | Legend [LegendConfig]
- | LineStyle [MarkProperty]
- | MarkStyle [MarkProperty]
- | NamedStyle Text [MarkProperty]
- | NumberFormat Text
- | Padding Padding
- | PointStyle [MarkProperty]
- | Projection [ProjectionProperty]
- | Range [RangeConfig]
- | RectStyle [MarkProperty]
- | RemoveInvalid Bool
- | RuleStyle [MarkProperty]
- | Scale [ScaleConfig]
- | SelectionStyle [(Selection, [SelectionProperty])]
- | SquareStyle [MarkProperty]
- | Stack StackProperty
- | TextStyle [MarkProperty]
- | TickStyle [MarkProperty]
- | TitleStyle [TitleConfig]
- | TimeFormat Text
- | View [ViewConfig]
- data Autosize
- data Padding
- data AxisConfig
- = BandPosition Double
- | Domain Bool
- | DomainColor Text
- | DomainWidth Double
- | MaxExtent Double
- | MinExtent Double
- | Grid Bool
- | GridColor Text
- | GridDash [Double]
- | GridOpacity Double
- | GridWidth Double
- | Labels Bool
- | LabelAngle Double
- | LabelColor Text
- | LabelFont Text
- | LabelFontSize Double
- | LabelLimit Double
- | LabelOverlap OverlapStrategy
- | LabelPadding Double
- | ShortTimeLabels Bool
- | Ticks Bool
- | TickColor Text
- | TickRound Bool
- | TickSize Double
- | TickWidth Double
- | TitleAlign HAlign
- | TitleAngle Double
- | TitleBaseline VAlign
- | TitleColor Text
- | TitleFont Text
- | TitleFontWeight FontWeight
- | TitleFontSize Double
- | TitleLimit Double
- | TitleMaxLength Double
- | TitlePadding Double
- | TitleX Double
- | TitleY Double
- data LegendConfig
- = CornerRadius Double
- | FillColor Text
- | Orient LegendOrientation
- | Offset Double
- | StrokeColor Text
- | LeStrokeDash [Double]
- | LeStrokeWidth Double
- | LePadding Double
- | GradientLabelBaseline VAlign
- | GradientLabelLimit Double
- | GradientLabelOffset Double
- | GradientStrokeColor Text
- | GradientStrokeWidth Double
- | GradientHeight Double
- | GradientWidth Double
- | LeLabelAlign HAlign
- | LeLabelBaseline VAlign
- | LeLabelColor Text
- | LeLabelFont Text
- | LeLabelFontSize Double
- | LeLabelLimit Double
- | LeLabelOffset Double
- | LeShortTimeLabels Bool
- | EntryPadding Double
- | SymbolColor Text
- | SymbolType Symbol
- | SymbolSize Double
- | SymbolStrokeWidth Double
- | LeTitleAlign HAlign
- | LeTitleBaseline VAlign
- | LeTitleColor Text
- | LeTitleFont Text
- | LeTitleFontSize Double
- | LeTitleFontWeight FontWeight
- | LeTitleLimit Double
- | LeTitlePadding Double
- data ScaleConfig
- = SCBandPaddingInner Double
- | SCBandPaddingOuter Double
- | SCClamp Bool
- | SCMaxBandSize Double
- | SCMinBandSize Double
- | SCMaxFontSize Double
- | SCMinFontSize Double
- | SCMaxOpacity Double
- | SCMinOpacity Double
- | SCMaxSize Double
- | SCMinSize Double
- | SCMaxStrokeWidth Double
- | SCMinStrokeWidth Double
- | SCPointPadding Double
- | SCRangeStep (Maybe Double)
- | SCRound Bool
- | SCTextXRangeStep Double
- | SCUseUnaggregatedDomain Bool
- data TitleConfig
- data APosition
- data ViewConfig
- data RangeConfig
- data FieldTitleProperty
- data DataValue
- data DataValues
- data DateTime
- data MonthName
- data DayName
Creating a Vega-Lite Specification
toVegaLite :: [(VLProperty, VLSpec)] -> VegaLite Source #
Convert a list of Vega-Lite specifications into a single JSON object that may be passed to Vega-Lite for graphics generation. Commonly these will include at least a data, mark, and encoding specification.
While simple properties like mark may be provided directly, it is usually clearer
to label more complex ones such as encodings as separate expressions. This becomes
increasingly helpful for visualizations that involve composition of layers, repeats
and facets.
Specifications can be built up by chaining a series of functions (such as dataColumn
or position in the example below). Functional composition using the . operator
allows this to be done compactly.
let dat = dataFromColumns []
          . dataColumn "a" (Strings [ "C", "C", "D", "D", "E", "E" ])
          . dataColumn "b" (Numbers [ 2, 7, 1, 2, 6, 8 ])

    enc = encoding
          . position X [ PName "a", PmType Nominal ]
          . position Y [ PName "b", PmType Quantitative, PAggregate Mean ]

in toVegaLite [ dat [], mark Bar [], enc [] ]
fromVL :: VegaLite -> VLSpec Source #
Extract the specification for passing to a VegaLite visualizer.
let vlSpec = fromVL vl
Data.ByteString.Lazy.Char8.putStrLn (Data.Aeson.Encode.Pretty.encodePretty vlSpec)
Note that there is no validation done to ensure that the output matches the Vega Lite schema. That is, it is possible to create an invalid visualization with this module (e.g. missing a data source or referring to an undefined field).
data VLProperty Source #
Top-level Vega-Lite properties. These are the ones that define the core of the visualization grammar. All properties are created by functions which can be arranged into seven broad groups:
- Data Properties
- These relate to the input data to be visualized. Generated by
dataFromColumns,dataFromRows,dataFromUrl,dataFromSourceanddataFromJson. - Transform Properties
- These indicate that some transformation of input data should
be applied before encoding them visually. Generated by
transformandprojectionthey can include data transformations such asfilter,binAsandcalculateAsand geo transformations of longitude, latitude coordinates used by marks such asGeoshape,Point, andLine. - Mark Properties
- These relate to the symbols used to visualize data items. They
are generated by
mark, and include types such asCircle,Bar, andLine. - Encoding Properties
- These specify which data elements are mapped to which mark characteristics
(known as channels). Generated by
encoding, they include encodings such asposition,color,size,shape,textandhyperlink. - Composition Properties
- These allow visualization views to be combined to form more
complex visualizations. Generated by
layer,repeat,facet,hConcat,vConcat,spec, andresolve. - Interaction Properties
- These allow interactions such as clicking, dragging and others
generated via a GUI or data stream to influence the visualization. Generated by
selection. - Supplementary and Configuration Properties
- These provide a means to add metadata and
styling to one or more visualizations. Generated by
name,title,description,background,height,width,padding,autosize, andconfigure.
A Vega Lite visualization, created by
toVegaLite. The contents can be extracted with fromVL.
type LabelledSpec = (Text, VLSpec) Source #
Represents a named Vega-Lite specification, usually generated by a
function in this module. You shouldn't need to create LabelledSpec
tuples directly, but they can be useful for type annotations.
type BuildLabelledSpecs = [LabelledSpec] -> [LabelledSpec] Source #
Represent those functions which can be chained together using function composition to append new specifications onto an existing list.
combineSpecs :: [LabelledSpec] -> VLSpec Source #
Combines a list of labelled specifications into a single specification. This is useful when you wish to create a single page with multiple visulizualizations.
combineSpecs
    [ ( "vis1", myFirstVis )
    , ( "vis2", mySecondVis )
    , ( "vis3", myOtherVis )
    ]
toHtmlFile :: FilePath -> VegaLite -> IO () Source #
Converts VegaLite to an html file. Uses Vega-Embed.
Creating the Data Specification
dataFromUrl :: Text -> [Format] -> Data Source #
Declare data source from a url. The url can be a local path on a web server or an external http(s) url. Used to create a data ( property, specification ) pair. An optional list of field formatting instructions can be provided as the second parameter or an empty list to use the default formatting. See the Vega-Lite documentation for details.
toVegaLite
    [ dataFromUrl "data/weather.csv" [ Parse [ ( "date", FoDate "%Y-%m-%d %H:%M" ) ] ]
    , mark Line []
    , enc []
    ]
dataFromColumns :: [Format] -> [DataColumn] -> Data Source #
Declare a data source from a provided list of column values. Each column contains
values of the same type, but columns each with a different type are permitted.
Columns should all contain the same number of items; if not the dataset will be
truncated to the length of the shortest column. An optional list of field formatting
instructions can be provided as the first parameter or an empty list to use the
default formatting. See the
Vega-Lite documentation
for details. The columns themselves are most easily generated with dataColumn
data =
    dataFromColumns [ Parse [ ( "Year", FoDate "%Y" ) ] ]
        . dataColumn "Animal" (Strings [ "Fish", "Dog", "Cat" ])
        . dataColumn "Age" (Numbers [ 28, 12, 6 ])
        . dataColumn "Year" (Strings [ "2010", "2014", "2015" ])
dataFromRows :: [Format] -> [DataRow] -> Data Source #
Declare a data source from a provided list of row values. Each row contains a list of tuples where the first value is a string representing the column name, and the second the column value for that row. Each column can have a value of a different type but you must ensure that when subsequent rows are added, they match the types of previous values with shared column names. An optional list of field formatting instructions can be provided as the first parameter or an empty list to use the default formatting. See the Vega-Lite documentation for details.
The rows themselves are most easily generated with dataRow. Note though that generally
if you are creating data inline (as opposed to reading from a file), adding data by column
is more efficient and less error-prone.
data = dataFromRows [ Parse [ ( "Year", FoDate "%Y" ) ] ]
        . dataRow [ ( "Animal", Str "Fish" ), ( "Age", Number 28 ), ( "Year", Str "2010" ) ]
        . dataRow [ ( "Animal", Str "Dog" ), ( "Age", Number 12 ), ( "Year", Str "2014" ) ]
        . dataRow [ ( "Animal", Str "Cat" ), ( "Age", Number 6 ), ( "Year", Str "2015" ) ]
dataFromJson :: VLSpec -> [Format] -> Data Source #
Declare a data source from a provided json specification. The most likely use-case
for specifying json inline is when creating geojson objects,
when geometry, geometryCollection, and geoFeatureCollection functions
may be used. For more general cases of json creation, consider encode.
let geojson =
        geometry (GeoPolygon [ [ ( -3, 59 ), ( 4, 59 ), ( 4, 52 ), ( -3, 59 ) ] ]) []
in toVegaLite
    [ width 200
    , height 200
    , dataFromJson geojson []
    , projection [ PType Orthographic ]
    , mark Geoshape []
    ]
dataFromSource :: Text -> [Format] -> Data Source #
Declare data from a named source. The source may be from named datasets within
a specification or a named data source created via the
Vega View API.
An optional list of field formatting instructions can be provided as the second
parameter or an empty list to use the default formatting. See the
Vega-Lite documentation
for details.
toVegaLite
    [ datasets [ ( "myData", data [] ),  ( "myJson", dataFromJson json [] ) ]
    , dataFromSource "myData" []
    , mark Bar []
    , enc []
    ]
datasets :: [(Text, Data)] -> Data Source #
Create a dataset comprising a collection of named Data items. Each data item
can be created with normal data generating functions such as dataFromRows or
dataFromJson. These can be later referred to using dataFromSource.
let toJS = Data.Aeson.toJSON
    obj = Data.Aeson.object

    data = dataFromRows []
            . dataRow [ ( "cat", Str "a" ), ( "val", Number 10 ) ]
            . dataRow [ ( "cat", Str "b" ), ( "val", Number 18 ) ]
    json = toJS
            [ obj [ ( "cat", toJS "a" ), ( "val", toJS 120 ) ]
            , obj [ ( "cat", toJS "b" ), ( "val", toJS 180 ) ]
            ]

    enc = ...

in toVegaLite
    [ datasets [ ( "myData", data [] ),  ( "myJson", dataFromJson json [] ) ]
    , dataFromSource "myData" []
    , mark Bar []
    , enc []
    ]
dataColumn :: Text -> DataValues -> [DataColumn] -> [DataColumn] Source #
Create a column of data. A column has a name and a list of values. The final parameter is the list of any other columns to which this is added.
dataColumn "Animal" (Strings [ "Cat", "Dog", "Mouse"]) []
dataRow :: [(Text, DataValue)] -> [DataRow] -> [DataRow] Source #
Create a row of data. A row comprises a list of (columnName, value) pairs. The final parameter is the list of any other rows to which this is added.
dataRow [("Animal", Str "Fish"), ("Age",Number 28), ("Year", Str "2010")] []
geometry :: Geometry -> [(Text, DataValue)] -> VLSpec Source #
Specifies a geometric object to be used in a geoShape specification. The first parameter is the geometric type, the second an optional list of properties to be associated with the object.
geojson =
    geometry (GeoPolygon [ [ ( -3, 59 ), ( 4, 59 ), ( 4, 52 ), ( -3, 59 ) ] ]) []
geoFeatureCollection :: [VLSpec] -> VLSpec Source #
Specifies a list of geo features to be used in a geoShape specification.
Each feature object in this collection can be created with the geometry
function.
geojson =
    geoFeatureCollection
        [ geometry (GeoPolygon [ [ ( -3, 59 ), ( -3, 52 ), ( 4, 52 ), ( -3, 59 ) ] ])
            [ ( "myRegionName", Str "Northern region" ) ]
        , geometry (GeoPolygon [ [ ( -3, 52 ), ( 4, 52 ), ( 4, 45 ), ( -3, 52 ) ] ])
            [ ( "myRegionName", Str "Southern region" ) ]
        ]
geometryCollection :: [VLSpec] -> VLSpec Source #
Specifies a list of geometry objects to be used in a geoShape specification.
Each geometry object in this collection can be created with the geometry
function.
geojson =
    geometryCollection
        [ geometry (GeoPolygon [ [ ( -3, 59 ), ( 4, 59 ), ( 4, 52 ), ( -3, 59 ) ] ]) []
        , geometry (GeoPoint -3.5 55.5) []
        ]
type Data = (VLProperty, VLSpec) Source #
Convenience type annotation label for use with data generation functions.
myRegion : [DataColumn] -> Data
myRegion =
    dataFromColumns []
        . dataColumn "easting" (Numbers [ -3, 4, 4, -3, -3 ])
        . dataColumn "northing" (Numbers [ 52, 52, 45, 45, 52 ])
type DataColumn = [LabelledSpec] Source #
Represents a single column of data. Used when generating inline data with
dataColumn.
type DataRow = VLSpec Source #
Represents a single row of data. Used when generating inline data with
dataRow.
Specifies the type of format a data source uses. If the format is indicated by
the file name extension (".tsv", ".csv", ".json") there is no need to indicate the
format explicitly. However this can be useful if the filename extension does not
indicate type (e.g. ".txt") or you wish to customise the parsing of a file. For
example, when specifying the JSON format, its parameter indicates the name of
property field containing the attribute data to extract. For details see the
Vega-Lite documentation.
Specifies the type and content of geometry specifications for programatically
creating GeoShapes. These can be mapped to the
GeoJson geometry object types
where the pluralised type names refer to their Multi prefixed equivalent in the
GeoJSON specification.
Indicates the type of data to be parsed when reading input data. For FoDate
and FoUtc, the formatting specification can be specified using
D3's formatting specifiers
or left as an empty string if default date formatting is to be applied. Care should
be taken when assuming default parsing of dates because different browsers can
parse dates differently. Being explicit about the date format is usually safer.
Creating the Transform Specification
transform :: [LabelledSpec] -> (VLProperty, VLSpec) Source #
Create a single transform from a list of transformation specifications. Note
that the order of transformations can be important, especially if labels created
with calculateAs, timeUnitAs, and binAs are used in other transformations.
Using the functional composition pipeline idiom (as example below) allows you to
provide the transformations in the order intended in a clear manner.
trans = transform
        . filter (FExpr "datum.year == 2010")
        . calculateAs "datum.sex == 2 ? Female : Male" "gender"
projection :: [ProjectionProperty] -> (VLProperty, VLSpec) Source #
Sets the cartographic projection used for geospatial coordinates. A projection
defines the mapping from (longitude,latitude) to an (x,y) plane used for rendering.
This is useful when using the Geoshape mark. For further details see the
Vega-Lite documentation.
proj = projection [ PType Orthographic, PRotate (-40) 0 0 ]
data ProjectionProperty Source #
Properties for customising a geospatial projection that converts longitude,latitude pairs into planar (x,y) coordinate pairs for rendering and query. For details see the Vega-Lite documentation.
data Projection Source #
Types of geographic map projection. These are based on a subset of those provided by the d3-geo library. For details of available projections see the Vega-Lite documentation.
Constructors
| Albers | |
| AlbersUsa | |
| AzimuthalEqualArea | |
| AzimuthalEquidistant | |
| ConicConformal | |
| ConicEqualArea | |
| ConicEquidistant | |
| Custom Text | Specify the name of the custom D3 prohection to use. See the Vega API for more information. |
| Equirectangular | |
| Gnomonic | |
| Mercator | |
| Orthographic | |
| Stereographic | |
| TransverseMercator |
Specifies a clipping rectangle in pixel units for defining the clip extent of a map projection.
Aggregation
Arguments
| :: [VLSpec] | The named aggregation operations to apply. |
| -> [Text] | The "group by" fields. |
| -> BuildLabelledSpecs |
Defines a set of named aggregation transformations to be used when encoding channels. This is useful when, for example, you wish to apply the same transformation to a number of channels but do not want to define it each time. For further details see the Vega-Lite documentation.
trans =
    transform
        . aggregate
            [ opAs Min "people" "lowerBound", opAs Max "people" "upperBound" ]
            [ "age" ]
Type of aggregation operation. See the Vega-Lite documentation for more details.
Arguments
| :: Operation | The aggregation operation to use. |
| -> Text | The name of the field which is to be aggregated. |
| -> Text | The name given to the transformed data. |
| -> VLSpec |
Create a named aggregation operation on a field that can be added to a transformation. For further details see the Vega-Lite documentation.
trans =
    transform
        . aggregate
            [ opAs Min "people" "lowerBound"
            , opAs Max "people" "upperBound"
            ]
            [ "age" ]
Arguments
| :: TimeUnit | The width of each bin. |
| -> Text | The field to bin. |
| -> Text | The name of the binned data created by this routine. |
| -> BuildLabelledSpecs |
Creates a new data field based on the given temporal binning. Unlike the direct encoding binning, this transformation is named and so can be referred to in multiple encodings. Note though that usually it is easer to apply the temporal binning directly as part of the encoding as this will automatically format the temporal axis. See the Vega-Lite documentation for further details.
The following example takes a temporal dataset and encodes daily totals from it grouping by month:
trans = transform . timeUnitAs Month "date" "monthly"

enc = encoding
        . position X [ PName "date", PmType Temporal, PTimeUnit Day ]
        . position Y [ PAggregate Sum, PmType Quantitative ]
        . detail [ DName "monthly", DmType Temporal ]
Binning
Arguments
| :: [BinProperty] | An empty list means that the default binning is used. |
| -> Text | The field to bin. |
| -> Text | The label for the binned data. |
| -> BuildLabelledSpecs |
Create a named binning transformation that may be referenced in other Transformations or encodings. See the Vega-Lite documentation for more details. Note that usually, direct binning within an encoding is preferred over this form of bin transformation.
trans =
    transform
        . binAs [ MaxBins 3 ] "IMDB_Rating" "ratingGroup"
data BinProperty Source #
Type of binning property to customise. See the Vega-Lite documentation for more details.
Data Calculation
Arguments
| :: Text | The calculation to perform. |
| -> Text | The field to assign the new values. |
| -> BuildLabelledSpecs |
Creates a new data field based on calculations from existing fields. See the Vega-Lite documentation for further details.
trans =
    transform . calculateAs "datum.sex == 2 ? F : M" "gender"
Filtering
filter :: Filter -> BuildLabelledSpecs Source #
Adds the given filter operation a list of transformations that may be applied to a channel or field. The first parameter is the filter operation and the second, often implicit, parameter is the list of other filter operations to which this should be added in sequence.
trans =
    transform
        . filter (FEqual "Animal" (Str "Cat"))
Filter operations can combine selections and data predicates with BooleanOp
expressions:
trans =
    transform
        . filter (FCompose (And (Expr "datum.Weight_in_lbs > 3000") (Selection "brush")))
Type of filtering operation. See the Vega-Lite documentation for details.
Constructors
| FEqual Text DataValue | |
| FExpr Text | |
| FCompose BooleanOp | |
| FSelection Text | |
| FOneOf Text DataValues | |
| FRange Text FilterRange |
data FilterRange Source #
A pair of filter range data values. The first argument is the inclusive minimum vale to accept and the second the inclusive maximum.
Relational Joining (lookup)
Arguments
| :: Text | The field in the primary data structure acting as the key. |
| -> Data | The secondary data source (e.g. the return from the data-generating
functions such as |
| -> Text | The name of the field in the secondary data source to match against the primary key. |
| -> [Text] | The list of fields to store when the keys match. |
| -> BuildLabelledSpecs |
Perform a lookup of named fields between two data sources. This allows you to find values in one data source based on the values in another (like a relational join).
Unlike lookupAs, this function will only return the specific fields named in the
fourth parameter. If you wish to return the entire set of fields in the secondary
data source as a single object, use lookupAs.
See the Vega-Lite documentation for further details.
The following would return the values in the age and height fields from
lookup_people.csv for all rows where the value in the name column in that
file matches the value of person in the primary data source.
trans =
    transform
        . lookup "person" (dataFromUrl "data/lookup_people.csv" []) "name" [ "age", "height" ]
Arguments
| :: Text | The field in the primary data structure acting as the key. |
| -> Data | The secondary data source (e.g. the return from the data-generating
functions such as |
| -> Text | The name of the field in the secondary data source to match against the primary key. |
| -> Text | The field name for the new data. |
| -> BuildLabelledSpecs |
Perform an object lookup between two data sources. This allows you to find values in one data source based on the values in another (like a relational join).
Unlike lookup, this function returns the entire set of field values from the
secondary data source when keys match. Those fields are stored as an object with
the name provided in the fourth parameter.
See the Vega-Lite documentation for further details.
In the following example, personDetails would reference all the field values in
lookup_people.csv for each row where the value in the name column in that
file matches the value of person in the primary data source.
trans = transform
        . lookupAs "person" (dataFromUrl "data/lookup_people.csv" []) "name" "personDetails"
Creating the Mark Specification
mark :: Mark -> [MarkProperty] -> (VLProperty, VLSpec) Source #
Create a mark specification. All marks must have a type (first parameter) and can optionally be customised with a list of mark properties such as interpolation style for lines. To keep the default style for the mark, just provide an empty list for the second parameter.
mark Circle []
mark Line [ MInterpolate StepAfter ]
Type of visual mark used to represent data in the visualization.
data MarkProperty Source #
Properties for customising the appearance of a mark. For details see the Vega-Lite documentation.
Not all properties are valid for each mark type.
Constructors
data MarkOrientation Source #
Indicates desired orientation of a mark (e.g. horizontally or vertically oriented bars).
Constructors
| Horizontal | |
| Vertical |
data MarkInterpolation Source #
Indicates mark interpolation style. See the Vega-Lite documentation for details.
Identifies the type of symbol.
Constructors
| SymCircle | |
| SymSquare | |
| Cross | |
| Diamond | |
| TriangleUp | |
| TriangleDown | |
| Path Text | Define a custom shape with a SVG path description. |
Represents the type of cursor to display. For an explanation of each type, see the CSS documentation.
Constructors
Creating the Encoding Specification
Types and functions for declaring which data fields are mapped to which
channels. Channels can include: position on screen (e.g. X, Y); visual
mark properties (color, size, stroke, shape); text; hyperlink;
ordering (order); level of detail; and facets for composed
visualizations (facet). All can be further customised via a series of
properties that determine how the encoding is implemented (such as
scaling, sorting, and spacing).
encoding :: [LabelledSpec] -> (VLProperty, VLSpec) Source #
Create an encoding specification from a list of channel encodings.
enc = encoding
        . position X [ PName "Animal", PmType Ordinal ]
        . position Y [ PName "Age", PmType Quantitative ]
        . shape [ MName "Species", MmType Nominal ]
        . size [ MName "Population", MmType Quantitative ]
data Measurement Source #
Type of measurement to be associated with some channel.
Constructors
| Nominal | Data are categories identified by name alone and which have no intrinsic order. |
| Ordinal | Data are also categories, but ones which have some natural order. |
| Quantitative | Data are numeric measurements typically on a continuous scale. |
| Temporal | Data represents time in some manner. |
| GeoFeature | Geospatial position encoding ( |
Position Channels
Arguments
| :: Position | The channel to encode. |
| -> [PositionChannel] | The options for the channel; this will usually include the name ( |
| -> BuildLabelledSpecs |
Encode a position channel.
enc =
    encoding
      . position X [ PName "Animal", PmType Ordinal ]
Encoding by position will generate an axis by default. To prevent the axis from
appearing, simply provide an empty list of axis properties to PAxis:
enc =
    encoding
      . position X [ PName "Animal", PmType Ordinal, PAxis [] ]
data PositionChannel Source #
Position channel properties used for creating a position channel encoding.
Type of position channel, X and Y represent horizontal and vertical axis
dimensions on a plane and X2 and Y2 represent secondary axis dimensions where
two scales are overlaid in the same space. Geographic positions represented by
longitude and latiutude values are identified with Longitude, Latitude and
their respective secondary equivalents. Such geographic position channels are
subject to a map projection (set using projection) before being placed graphically.
data SortProperty Source #
Allow type of sorting to be customised. For details see the Vega-Lite documentation.
Constructors
| Ascending | |
| Descending | |
| Op Operation | |
| ByField Text | |
| ByRepeat Arrangement |
data StackProperty Source #
Describes the type of stacking to apply to a bar chart.
Constructors
| StZero | |
| StNormalize | |
| StCenter | |
| NoStack |
data AxisProperty Source #
Axis customisation properties. These are used for customising individual axes.
To configure all axes, use AxisConfig with a configuration instead. See the
Vega-Lite documentation
for more details.
Constructors
data OverlapStrategy Source #
Type of overlap strategy to be applied when there is not space to show all items on an axis. See the Vega-Lite documentation for more details.
Indicates the horizontal alignment of text such as on an axis or legend.
Constructors
| AlignCenter | |
| AlignLeft | |
| AlignRight |
Indicates the vertical alignment of text that may be attached to a mark.
Constructors
| AlignTop | |
| AlignMiddle | |
| AlignBottom |
data FontWeight Source #
Indicates the weight options for a font.
Describes a unit of time. Useful for encoding and transformations. See the Vega-Lite documentation for further details.
encoding
    . position X [ PName "date", PmType Temporal, PTimeUnit (Utc YearMonthDateHours) ]
Constructors
| Year | |
| YearQuarter | |
| YearQuarterMonth | |
| YearMonth | |
| YearMonthDate | |
| YearMonthDateHours | |
| YearMonthDateHoursMinutes | |
| YearMonthDateHoursMinutesSeconds | |
| Quarter | |
| QuarterMonth | |
| Month | |
| MonthDate | |
| Date | |
| Day | |
| Hours | |
| HoursMinutes | |
| HoursMinutesSeconds | |
| Minutes | |
| MinutesSeconds | |
| Seconds | |
| SecondsMilliseconds | |
| Milliseconds | |
| Utc TimeUnit | Encode a time as UTC (coordinated universal time, independent of local time zones or daylight saving). |
Mark channels
Arguments
| :: [MarkChannel] | What data values are used to control the size parameters of the mark. |
| -> BuildLabelledSpecs |
Encode a size channel.
size [ MName "Age", MmType Quantitative ] []
Arguments
| :: [MarkChannel] | Control how the data field is encoded by color. |
| -> BuildLabelledSpecs |
Encode a color channel.
color [ MName "Species", MmType Nominal ] []
Encoding a color channel will generate a legend by default. To stop the legend
appearing, just supply an empty list of legend properties to MLegend:
color [ MName "Species", MmType Nominal, MLegend [] ] []
fill :: [MarkChannel] -> BuildLabelledSpecs Source #
Encode a fill channel. This acts in a similar way to encoding by color but
only affects the interior of closed shapes. The first parameter is a list of mark
channel properties that characterise the way a data field is encoded by fill.
The second parameter is a list of any previous channels to which this fill channel
should be added.
fill [ MName "Species", MmType Nominal ] []
Note that if both fill and color encodings are specified, fill takes precedence.
Arguments
| :: [MarkChannel] | What data values are used to control the stoke parameters of the mark. |
| -> BuildLabelledSpecs |
opacity :: [MarkChannel] -> BuildLabelledSpecs Source #
Encode an opacity channel. The first parameter is a list of mark channel properties that characterise the way a data field is encoded by opacity. The second parameter is a list of any previous channels to which this opacity channel should be added.
opacity [ MName "Age", MmType Quantitative ] []
Arguments
| :: [MarkChannel] | What data values are used to control the shape parameters of the mark. |
| -> BuildLabelledSpecs |
Encode a shape channel.
shape [ MName "Species", MmType Nominal ] []
data MarkChannel Source #
Mark channel properties used for creating a mark channel encoding.
Constructors
| MName Text | |
| MRepeat Arrangement | |
| MmType Measurement | |
| MScale [ScaleProperty] | Use an empty list to remove the scale. |
| MBin [BinProperty] | |
| MTimeUnit TimeUnit | |
| MAggregate Operation | |
| MLegend [LegendProperty] | Use an empty list to remove the legend. |
| MSelectionCondition BooleanOp [MarkChannel] [MarkChannel] | |
| MDataCondition BooleanOp [MarkChannel] [MarkChannel] | |
| MPath Text | |
| MNumber Double | |
| MString Text | |
| MBoolean Bool |
data LegendProperty Source #
Legend properties. For more detail see the Vega-Lite documentation.
Indicates the type of legend to create.
data LegendOrientation Source #
Indicates the legend orientation. See the Vega-Lite documentation for more details.
Constructors
| LOBottomLeft | |
| LOBottomRight | |
| LOLeft | |
| LONone | |
| LORight | |
| LOTopLeft | |
| LOTopRight |
data LegendValues Source #
A list of data values suitable for setting legend values.
Text Channels
Arguments
| :: [TextChannel] | What data values are used to control the text parameters. |
| -> BuildLabelledSpecs |
Encode a text channel. See the Vega-Lite documentation for further details on the text and tooltip channels and Vega-Lite formatting documentation for formatting the appearance of the text.
enc =
    encoding
        . position X [ PName "miles", PmType Quantitative ]
        . position Y [ PName "gas", PmType Quantitative ]
        . text [ TName "miles", TmType Quantitative ]
Arguments
| :: [TextChannel] | The properties for the channel. |
| -> BuildLabelledSpecs |
Encode a tooltip channel. See the Vega-Lite documentation for further details on the text and tooltip channels and Vega-Lite formatting documentation for formatting the appearance of the text.
enc = encoding
        . position X [ PName "Horsepower", PmType Quantitative ]
        . position Y [ PName "Miles_per_Gallon", PmType Quantitative ]
        . tooltip [ TName "Year", TmType Temporal, TFormat "%Y" ]
data TextChannel Source #
Types of text channel property used for displaying text as part of the visualization.
Hyperlink Channels
Channels which offer a clickable URL destination. Unlike most other channels, the hyperlink channel has no direct visual expression other than the option of changing the cursor style when hovering, so an encoding will usually pair hyperlinks with other visual channels such as marks or texts.
hyperlink :: [HyperlinkChannel] -> BuildLabelledSpecs Source #
Encode a hyperlink channel. The first parameter is a list of hyperlink channel properties that characterise the hyperlinking such as the destination url and cursor type. The second parameter is a list of any previous encoding channels to which this hyperlink channel should be added.
hyperlink [ HName "Species", HmType Nominal ] []
For further details see the Vega-Lite documentation.
data HyperlinkChannel Source #
Types of hyperlink channel property used for linking marks or text to URLs.
Order Channels
Channels that relate to the order of data fields such as for sorting stacking order or order of data points in a connected scatterplot. See the Vega-Lite documentation for further details.
order :: [OrderChannel] -> BuildLabelledSpecs Source #
Encode an order channel. The first parameter is a list of order field definitions to define the channel. The second parameter is a list of any previous channels to which this order channel is to be added.
enc =
    encoding
        . position X [ PName "miles", PmType Quantitative ]
        . position Y [ PName "gas", PmType Quantitative ]
        . order [ OName "year", OmType Temporal ]
data OrderChannel Source #
Properties of an ordering channel used for sorting data fields.
Constructors
| OName Text | |
| ORepeat Arrangement | |
| OmType Measurement | |
| OBin [BinProperty] | |
| OAggregate Operation | |
| OTimeUnit TimeUnit | |
| OSort [SortProperty] |
Facet Channels
Channels for faceting single plots into small multiples. Can be used to create trellis plots or other arrangements in rows and columns. See the Vega-Lite documentation for further details. See also, faceted views for a more flexible (but more verbose) way of defining faceted views.
Arguments
| :: [FacetChannel] | The facet properties for the channel; this should include the name of
the field ( |
| -> BuildLabelledSpecs |
Encode a new facet to be arranged in rows.
enc =
    encoding
        . position X [ PName "people", PmType Quantitative ]
        . position Y [ PName "gender", PmType Nominal ]
        . row [ FName "age", FmType Ordinal ]
Arguments
| :: [FacetChannel] | The list of properties that define the faceting channel. At a minimum
this should include the data field ( |
| -> BuildLabelledSpecs |
Encodes a new facet to be arranged in columns.
enc =
    encoding
        . position X [ PName "people", PmType Quantitative ]
        . position Y [ PName "gender", PmType Nominal ]
        . column [ FName "age", FmType Ordinal ]
Level of detail Channel
Used for grouping data but without changing the visual appearance of a mark. When, for example, a field is encoded by color, all data items with the same value for that field are given the same color. When a detail channel encodes a field, all data items with the same value are placed in the same group. This allows, for example a line chart with multiple lines to be created – one for each group. See the Vega-Lite documentation for more information.
detail :: [DetailChannel] -> BuildLabelledSpecs Source #
Encode a "level of detail" channel. This provides a way of grouping by a field
but unlike, say color, all groups have the same visual properties. The first
parameter is a list of the field characteristics to be grouped. The second parameter
is a list of any previous channels to which this detail channel should be added. See the
Vega-Lite documentation
for details.
detail [ DName "Species", DmType Nominal ] []
data DetailChannel Source #
Level of detail channel properties used for creating a grouped channel encoding.
Constructors
| DName Text | |
| DmType Measurement | |
| DBin [BinProperty] | |
| DTimeUnit TimeUnit | |
| DAggregate Operation |
Scaling
data ScaleProperty Source #
Individual scale property. These are used to customise an individual scale
transformation. To customise all scales use config and supply relevant
ScaleConfig values. For more details see the
Vega-Lite documentation.
Used to indicate the type of scale transformation to apply.
Constructors
| ScLinear | |
| ScPow | |
| ScSqrt | |
| ScLog | |
| ScTime | |
| ScUtc | |
| ScSequential | |
| ScOrdinal | |
| ScBand | |
| ScPoint | |
| ScBinLinear | |
| ScBinOrdinal |
categoricalDomainMap :: [(Text, Text)] -> [ScaleProperty] Source #
Create a set of discrete domain to color mappings suitable for customising categorical
scales. The first item in each tuple should be a domain value and the second the
color value with which it should be associated. It is a convenience function equivalent
to specifying separate SDomain and SRange lists and is safer as it guarantees
a one-to-one correspondence between domain and range values.
color
    [ MName "weather"
    , MmType Nominal
    , MScale (
        categoricalDomainMap
            [ ( "sun", "yellow" )
            , ( "rain", "blue" )
            , ( "fog", "grey" )
            ]
        )
    ]
domainRangeMap :: (Double, Text) -> (Double, Text) -> [ScaleProperty] Source #
Create a pair of continuous domain to color mappings suitable for customising
ordered scales. The first parameter is a tuple representing the mapping of the lowest
numeric value in the domain to its equivalent color; the second tuple the mapping
of the highest numeric value to color. If the domain contains any values between
these lower and upper bounds they are interpolated according to the scale's interpolation
function. This is a convenience function equivalent to specifying separate SDomain
and SRange lists and is safer as it guarantees a one-to-one correspondence between
domain and range values.
color
    [ MName "year"
    , MmType Ordinal
    , MScale (domainRangeMap ( 1955, "911a24" ))
    ]
data ScaleDomain Source #
Describes the scale domain (type of data in scale). For full details see the Vega-Lite documentation.
Constructors
| DNumbers [Double] | |
| DStrings [Text] | |
| DDateTimes [[DateTime]] | |
| DSelection Text | |
| Unaggregated |
data ScaleRange Source #
Describes a scale range of scale output values. For full details see the Vega-Lite documentation.
Describes the way a scale can be rounded to "nice" numbers. For full details see the Vega-Lite documentation.
data CInterpolate Source #
Indicates the type of color interpolation to apply, when mapping a data field
onto a color scale. Note that color interpolation cannot be applied with the default
"sequential" color scale (ScSequential), so additionally, you should set the
SType to another continuous scale such as ScLinear and ScPow.
For details see the Vega-Lite documentation.
Constructors
| CubeHelix Double | The numeric value is the gamma value for the scheme (the recommended value is 1). |
| CubeHelixLong Double | The numeric value is the gamma value for the scheme (the recommended value is 1). |
| Hcl | |
| HclLong | |
| Hsl | |
| HslLong | |
| Lab | |
| Rgb Double | The numeric value is the gamma value for the scheme (the recommended value is 1). |
Creating view compositions
Views can be combined to create more complex multiview displays. This may involve
layering views on top of each other (superposition) or laying them out in adjacent
spaces (juxtaposition using repeat, facet, hConcat, or vConcat). Where different
views have potentially conflicting channels (for example, two position scales in
a layered visualization) the rules for resolving them can be defined with resolve.
For details of creating composite views see the
Vega-Lite documentation.
layer :: [VLSpec] -> (VLProperty, VLSpec) Source #
Assigns a list of specifications to superposed layers in a visualization.
toVegaLite
    [ dataFromUrl "data/driving.json" []
    , layer [ spec1, spec2 ]
    ]
hConcat :: [VLSpec] -> (VLProperty, VLSpec) Source #
Assigns a list of specifications to be juxtaposed horizontally in a visualization.
toVegaLite
    [ dataFromUrl "data/driving.json" []
    , hConcat [ spec1, spec2 ]
    ]
vConcat :: [VLSpec] -> (VLProperty, VLSpec) Source #
Assigns a list of specifications to be juxtaposed vertically in a visualization.
toVegaLite
    [ dataFromUrl "data/driving.json" []
    , vConcat [ spec1, spec2 ]
    ]
resolve :: [LabelledSpec] -> (VLProperty, VLSpec) Source #
Determine whether scales, axes or legends in composite views should share channel encodings. This allows, for example, two different color encodings to be created in a layered view, which otherwise by default would share color channels between layers. Each resolution rule should be in a tuple pairing the channel to which it applies and the rule type.
let res = resolve
            . resolution (RLegend [ ( ChColor, Independent ) ])
in toVegaLite
    [ dataFromUrl "data/movies.json" []
    , vConcat [ heatSpec, barSpec ]
    , res []
    ]
For more information see the Vega-Lite documentation.
resolution :: Resolve -> BuildLabelledSpecs Source #
Define a single resolution option to be applied when scales, axes or legends in composite views share channel encodings. This allows, for example, two different color encodings to be created in a layered view, which otherwise by default would share color channels between layers. Each resolution rule should be in a tuple pairing the channel to which it applies and the rule type.
resolve
    . resolution (RScale [ ( ChY, Independent ) ])
Used to determine how a channel's axis, scale or legend domains should be resolved if defined in more than one view in a composite visualization. See the Vega-Lite documentation for details.
Constructors
| RAxis [(Channel, Resolution)] | |
| RLegend [(Channel, Resolution)] | |
| RScale [(Channel, Resolution)] |
Indicates a channel type to be used in a resolution specification.
data Resolution Source #
Indicates whether or not a scale domain should be independent of others in a composite visualization. See the Vega-Lite documentation for details.
Constructors
| Shared | |
| Independent |
Faceted views
These are small multiples each of which show subsets of the same dataset. The specification determines which field should be used to determine subsets along with their spatial arrangement (in rows or columns). For details see the Vega-Lite documentation.
repeat :: [RepeatFields] -> (VLProperty, VLSpec) Source #
Define the fields that will be used to compose rows and columns of a set of
small multiples. This is used where the encoding of the visualization in small
multiples is largely identical, but the data field used in each might vary. When
a list of fields is identified with repeat you also need to define a full specification
to apply to each of those fields using asSpec.
toVegaLite
    [ repeat [ ColumnFields [ "Cat", "Dog", "Fish" ] ]
    , specification (asSpec spec)
    ]
See the Vega-Lite documentation for further details.
data RepeatFields Source #
Create a list of fields to use in set of repeated small multiples. The list of
fields named here can be referenced in an encoding with PRepeat Column
or PRepeat Row.
Constructors
| RowFields [Text] | |
| ColumnFields [Text] |
facet :: [FacetMapping] -> (VLProperty, VLSpec) Source #
Defines the fields that will be used to facet a view in rows or columns to create
a set of small multiples. This is used where the encoding of the visualization in small
multiples is identical, but data for each is grouped by the given fields. When
creating a faceted view in this way you also need to define a full specification
to apply to each of those facets using asSpec.
toVegaLite
    [ facet [ RowBy [ FName "Origin", FmType Nominal ] ]
    , specifcation spec
    ]
See the Vega-Lite documentation for further details.
data FacetMapping Source #
Provides details of the mapping between a row or column and its field definitions in a set of faceted small multiples. For details see the Vega-Lite documentation.
Constructors
| ColumnBy [FacetChannel] | |
| RowBy [FacetChannel] |
data FacetChannel Source #
Types of facet channel property used for creating a composed facet view of small multiples.
Constructors
| FName Text | |
| FmType Measurement | |
| FBin [BinProperty] | |
| FAggregate Operation | |
| FTimeUnit TimeUnit | |
| FHeader [HeaderProperty] |
asSpec :: [(VLProperty, VLSpec)] -> VLSpec Source #
Create a specification sufficient to define an element in a composed visualization such as a superposed layer or juxtaposed facet. Typically a layer will contain a full set of specifications that define a visualization with the exception of the data specification which is usually defined outside of any one layer. Whereas for repeated and faceted specs, the entire specification is provided.
spec1 = asSpec [ enc1 [], mark Line [] ]
specification :: VLSpec -> (VLProperty, VLSpec) Source #
Defines a specification object for use with faceted and repeated small multiples.
toVegaLite
    [ facet [ RowBy [ FName "Origin", FmType Nominal ] ]
    , specifcation spec
    ]
data Arrangement Source #
Identifies whether a repeated or faceted view is arranged in rows or columns.
data HeaderProperty Source #
Represents a facet header property. For details, see the Vega-Lite documentation.
Creating Selections for Interaction
Selections are the way in which interactions (such as clicking or dragging) can be responded to in a visualization. They transform interactions into data queries. For details, see the Vega-Lite documentation.
selection :: [LabelledSpec] -> (VLProperty, VLSpec) Source #
Create a full selection specification from a list of selections. For details see the Vega-Lite documentation.
selection = selection . select "view" Interval [ BindScales ]
Arguments
| :: Text | The name given to the selection. |
| -> Selection | The type of the selection. |
| -> [SelectionProperty] | What options are applied to the selection. |
| -> BuildLabelledSpecs |
Create a single named selection that may be applied to a data query or transformation.
sel =
    selection
        . select "view" Interval [ BindScales ] []
        . select "myBrush" Interval []
        . select "myPaintbrush" Multi [ On "mouseover", Nearest True ]
Indicates the type of selection to be generated by the user.
data SelectionProperty Source #
Properties for customising the nature of the selection. See the Vega-Lite documentation for details.
Constructors
| On Text | A Vega event stream
or the empty string (which sets the property to |
| Translate Text | A Vega event stream
or the empty string (which sets the property to |
| Zoom Text | A Vega event stream
or the empty string (which sets the property to |
| Fields [Text] | |
| Encodings [Channel] | |
| Empty | |
| ResolveSelections SelectionResolution | |
| SelectionMark [SelectionMarkProperty] | |
| BindScales | |
| Bind [Binding] | |
| Nearest Bool | |
| Toggle Text | A Vega expression that evaluates
to |
Describes the binding property of a selection based on some HTML input element such as a checkbox or radio button. For details see the Vega-Lite documentation and the Vega input binding documentation.
Constructors
data InputProperty Source #
GUI Input properties. The type of relevant property will depend on the type of
input element selected. For example an InRange (slider) can have numeric min,
max and step values; InSelect (selector) has a list of selection label options.
For details see the
Vega input element binding documentation.
The debounce property, available for all input types allows a delay in input event
handling to be added in order to avoid unnecessary event broadcasting. The Element
property is an optional CSS selector indicating the parent element to which the
input element should be added. This allows the option of the input element to be
outside the visualization container.
data SelectionResolution Source #
Determines how selections in faceted or repeated views are resolved. See the Vega-Lite documentation for details
Constructors
| Global | |
| Union | |
| Intersection |
data SelectionMarkProperty Source #
Properties for customising the appearance of an interval selection mark (dragged rectangle). For details see the Vega-Lite documentation.
Making conditional channel encodings
Sometimes it is useful to make channel encoding conditional on something. For example,
on the result of some interaction such as clicking or dragging or some data property
such whether null or an outlier. MSelectionCondition and TSelectionCondition will
encode a mark or text dependent on an interactive selection. MDataCondition
and TDataCondition will encode it dependening on some data property.
For interaction, once a selection has been defined and named, supplying a set of
MSelectionCondition encodings allow mark encodings to become dependent on that selection.
MSelectionCondition is followed firstly by a Boolean expression relating to the
selection upon which it is dependent, then an "if" and an "else" clause. Each clause
is a list of mark field encodings that should be applied when the selection is true
(the "if clause") and when it is false (the "else clause"). The color encoding below
is saying "whenever data marks are selected with an interval mouse drag, encode
the cylinder field with an ordinal color scheme, else make them grey".
sel = selection . select "myBrush" Interval []

enc = encoding
        . position X [ PName "Horsepower", PmType Quantitative ]
        . position Y [ PName "Miles_per_Gallon", PmType Quantitative ]
        . color
            [ MSelectionCondition (SelectionName "myBrush")
                [ MName "Cylinders", MmType Ordinal ]
                [ MString "grey" ]
            ]
In a similar way, MDataCondition will encocode a mark in one of two ways depending
on whether a predicate test is satisfied.
enc = encoding
        . position X [ PName "IMDB_Rating", PmType Quantitative ]
        . position Y [ PName "Rotten_Tomatoes_Rating", PmType Quantitative ]
          . color
              [ MDataCondition
                  (Or (Expr "datum.IMDB_Rating === null")
                      (Expr "datum.Rotten_Tomatoes_Rating === null")
                  )
                  [ MString "#ddd" ]
                  [ MString "#0099ee" ]
              ]
For details, see the Vega-Lite documentation.
Used for creating logical compositions. For example
color
    [ MSelectionCondition (Or (SelectionName "alex") (SelectionName "morgan"))
        [ MAggregate Count, MName "*", MmType Quantitative ]
        [ MString "gray" ]
    ]
Logical compositions can be nested to any level as shown in this example
Not (And (Expr "datum.IMDB_Rating === null") (Expr "datum.Rotten_Tomatoes_Rating === null") )
Global Configuration
name :: Text -> (VLProperty, VLSpec) Source #
Provides an optional name to be associated with the visualization.
toVegaLite
    [ name "PopGrowth"
    , dataFromUrl "data/population.json" []
    , mark Bar []
    , enc []
    ]
title :: Text -> (VLProperty, VLSpec) Source #
Provide an optional title to be displayed in the visualization.
toVegaLite
    [ title "Population Growth"
    , dataFromUrl "data/population.json" []
    , mark Bar []
    , enc []
    ]
description :: Text -> (VLProperty, VLSpec) Source #
Provides an optional description to be associated with the visualization.
toVegaLite
    [ description "Population change of key regions since 1900"
    , dataFromUrl "data/population.json" []
    , mark Bar []
    , enc []
    ]
height :: Double -> (VLProperty, VLSpec) Source #
Overrides the default height of the visualization. If not specified the height will be calculated based on the content of the visualization.
toVegaLite
    [ height 300
    , dataFromUrl "data/population.json" []
    , mark Bar []
    , enc []
    ]
width :: Double -> (VLProperty, VLSpec) Source #
Override the default width of the visualization. If not specified the width will be calculated based on the content of the visualization.
toVegaLite
    [ width 500
    , dataFromUrl "data/population.json" []
    , mark Bar []
    , enc []
    ]
padding :: Padding -> (VLProperty, VLSpec) Source #
Set the padding around the visualization in pixel units. The way padding is
interpreted will depend on the autosize properties. See the
Vega-Lite documentation
for details.
toVegaLite
    [ width 500
    , padding (PEdges 20 10 5 15)
    , dataFromUrl "data/population.json" []
    , mark Bar []
    , enc []
    ]
autosize :: [Autosize] -> (VLProperty, VLSpec) Source #
Declare the way the view is sized. See the Vega-Lite documentation for details.
toVegaLite
    [ width 250
    , height 300
    , autosize [ AFit, APadding, AResize ]
    , dataFromUrl "data/population.json" []
    , mark Bar []
    , enc []
    ]
background :: Text -> (VLProperty, VLSpec) Source #
Set the background color of the visualization. Should be specified with a CSS string such as "#ffe" or "rgb(200,20,150)". If not specified the background will be transparent.
toVegaLite
    [ background "rgb(251,247,238)"
    , dataFromUrl "data/population.json" []
    , mark Bar []
    , enc []
    ]
configure :: [LabelledSpec] -> (VLProperty, VLSpec) Source #
Create a single global configuration from a list of configuration specifications. Configurations are applied to all relevant items in the specification. See the Vega-Lite documentation for more details.
config =
    configure
        . configuration (Axis [ DomainWidth 1 ])
        . configuration (View [ Stroke (Just "transparent") ])
        . configuration (SelectionStyle [ ( Single, [ On "dblclick" ] ) ])
configuration :: ConfigurationProperty -> BuildLabelledSpecs Source #
Defines a single configuration option to be applied globally across the visualization. The first parameter identifies the type of configuration, the second a list of previous configurations to which this one may be added.
configuration (Axis [ DomainWidth 4 ]) []
data ConfigurationProperty Source #
Type of configuration property to customise. See the Vega-Lite documentation for details.
Constructors
Indicates the auto-sizing characteristics of the visualization such as amount of padding, whether it should fill the parent container etc. For more details see the Vega-Lite documentation.
Specify the padding dimensions in pixel units.
data AxisConfig Source #
Axis configuration options for customising all axes. See the Vega-Lite documentation for more details.
Constructors
data LegendConfig Source #
Legend configuration options. For more detail see the Vega-Lite documentation.
Constructors
data ScaleConfig Source #
Scale configuration property. These are used to configure all scales. For more details see the Vega-Lite documentation.
Constructors
data TitleConfig Source #
Title configuration properties. These are used to configure the default style of all titles within a visualization. For further details see the Vega-Lite documentation.
data ViewConfig Source #
View configuration property. These are used to configure the style of a single view within a visualization such as its size and default fill and stroke colors. For further details see the Vega-Lite documentation.
data RangeConfig Source #
Properties for customising the colors of a range. The parameter should be a
named color scheme such as "accent" or "purpleorange-11". For details see the
Vega-Lite documentation.
data FieldTitleProperty Source #
Indicates the style in which field names are displayed.
General Data types
A single data value. This is used when a function can accept values of different types (e.g. either a number or a string).
data DataValues Source #
A list of data values. This is used when a function can accept lists of different types (e.g. either a list of numbers or a list of strings).
Allows a date or time to be represented. This is typically part of a list of
DateTime items to provide a specific point in time. For details see the
Vega-Lite documentation.
Identifies a month of the year.