hanalyze: A general-purpose statistical analysis, optimization and visualization toolkit
hanalyze is a self-contained Haskell toolkit for classical regression
(LM, GLM, GLMM, splines, kernels, GP, RFF), Bayesian modeling
(HBM DSL with MH, HMC, NUTS, Gibbs, ADVI), design of experiments
(full/fractional factorial, RSM, D-optimal, orthogonal arrays, Taguchi),
optimization (Nelder-Mead, L-BFGS, DE, CMA-ES, NSGA-II, Bayesian
optimization, augmented Lagrangian), and Vega-Lite-based visualization
with HTML PNG SVG output.
.
All algorithms are implemented natively in Haskell — no R Stan Python
bridges. Data interchange uses the dataframe package as a first-class
citizen.
.
This is the umbrella package: it re-exports all 200 modules of the six
split layers (core, frame, bayes, models, design, viz) under their
original names, so depending on this one package is enough and downstream
imports never have to change. It also implements four modules of its own
that cut across the layers -- the quickstart front end
Hanalyze, the unified fit operator (|->) in
Hanalyze.Fit, coefficient diagnostics in
Hanalyze.Diagnostics, and the plotting wrappers in
Hanalyze.Model.Wrappers.
.
The unified hanalyze command-line interface (regress, info, hist,
doe, taguchi, ridge, kernel, spline, multireg, clean,
melt, regrid, ...) ships separately in the hanalyze-cli
package. See README.md for the layer map and a usage example.
[Skip to Readme]


Modules
[Index] [Quick Jump]
- Hanalyze
- Data
- Hanalyze.Data.ColumnSource
- Hanalyze.Data.Factor
- Hanalyze.Data.Strings
- Hanalyze.Data.Transform
- Hanalyze.Data.Wrangle
- DataIO
- Hanalyze.DataIO.CSV
- Hanalyze.DataIO.Clean
- Hanalyze.DataIO.Convert
- Hanalyze.DataIO.External
- Hanalyze.DataIO.Health
- Hanalyze.DataIO.Log
- Hanalyze.DataIO.Preprocess
- Hanalyze.DataIO.Reshape
- Hanalyze.DataIO.Sniff
- Design
- Hanalyze.Design.Anova
- Hanalyze.Design.Block
- Hanalyze.Design.Constraint
- Custom
- Hanalyze.Design.Custom.Augment
- Hanalyze.Design.Custom.Bayesian
- Hanalyze.Design.Custom.Compare
- Hanalyze.Design.Custom.Constraint
- Hanalyze.Design.Custom.Coordinate
- Hanalyze.Design.Custom.Factor
- Hanalyze.Design.Custom.Model
- Hanalyze.Design.Custom.Power
- Hanalyze.Design.Custom.RegionMoment
- Hanalyze.Design.Custom.SplitPlot
- Hanalyze.Design.Custom.Structured
- Hanalyze.Design.DSD
- Hanalyze.Design.Diagnostics
- Hanalyze.Design.Factorial
- Hanalyze.Design.GaugeRR
- Hanalyze.Design.Mixed
- Hanalyze.Design.Mixture
- Hanalyze.Design.MultiRSM
- Hanalyze.Design.Optimal
- Hanalyze.Design.Orthogonal
- Hanalyze.Design.Power
- Hanalyze.Design.Quality
- Hanalyze.Design.RSM
- Hanalyze.Design.Sequential
- Hanalyze.Design.SpaceFilling
- Hanalyze.Design.Taguchi
- Hanalyze.Design.Workflow
- Hanalyze.Diagnostics
- Hanalyze.Fit
- MCMC
- Hanalyze.MCMC.BayesianTest
- Hanalyze.MCMC.Core
- Hanalyze.MCMC.Gibbs
- Hanalyze.MCMC.HMC
- Hanalyze.MCMC.MH
- Hanalyze.MCMC.NUTS
- Hanalyze.MCMC.Progress
- Hanalyze.MCMC.SMC
- Hanalyze.MCMC.Slice
- Math
- Hanalyze.Math.HSIC
- Hanalyze.Math.Hungarian
- Hanalyze.Math.ICA
- Model
- Hanalyze.Model.AFT
- Hanalyze.Model.Cluster
- Hanalyze.Model.CompetingRisks
- Hanalyze.Model.Core
- Hanalyze.Model.DAG
- Hanalyze.Model.DecisionTree
- Hanalyze.Model.Discriminant
- Hanalyze.Model.FDA
- Hanalyze.Model.FitYByX
- Hanalyze.Model.Formula
- Hanalyze.Model.Formula.Design
- Hanalyze.Model.Formula.Frame
- Hanalyze.Model.Formula.Mixed
- Hanalyze.Model.Formula.Nonlinear
- Hanalyze.Model.Formula.RFormula
- Hanalyze.Model.GAM
- Hanalyze.Model.GARCH
- Hanalyze.Model.GLM
- Hanalyze.Model.GLMM
- Hanalyze.Model.GP
- Hanalyze.Model.GPRobust
- Hanalyze.Model.GradientBoosting
- Hanalyze.Model.HBM
- Hanalyze.Model.HBM.Ast
- Hanalyze.Model.HBM.Distribution
- Hanalyze.Model.HBM.Eval
- Hanalyze.Model.HBM.Gradient
- Hanalyze.Model.HBM.IR
- Hanalyze.Model.HBM.Interp
- Hanalyze.Model.HBM.Model
- Hanalyze.Model.HBM.Sampling
- Hanalyze.Model.HBM.Track
- Hanalyze.Model.HBM.Util
- Hanalyze.Model.HBM.VecAD
- Hanalyze.Model.HierarchicalCluster
- Hanalyze.Model.KNN
- Hanalyze.Model.Kernel
- Hanalyze.Model.KernelRegression
- Hanalyze.Model.LM
- Hanalyze.Model.LM.Diagnostics
- Hanalyze.Model.LatentClassAnalysis
- LiNGAM
- Hanalyze.Model.LiNGAM.Bootstrap
- Hanalyze.Model.LiNGAM.Direct
- Hanalyze.Model.LiNGAM.ICA
- Hanalyze.Model.LiNGAM.MultiGroup
- Hanalyze.Model.LiNGAM.Pairwise
- Hanalyze.Model.LiNGAM.Parce
- Hanalyze.Model.LiNGAM.VAR
- Hanalyze.Model.MDS
- Hanalyze.Model.MultiGP
- Hanalyze.Model.MultiLM
- Hanalyze.Model.MultiOutput
- Hanalyze.Model.Multivariate
- Hanalyze.Model.NaiveBayes
- Hanalyze.Model.NeuralNetwork
- Hanalyze.Model.PCA
- Hanalyze.Model.PLS
- Hanalyze.Model.PartialDependence
- Hanalyze.Model.Quantile
- Hanalyze.Model.RFF
- Hanalyze.Model.RandomForest
- Hanalyze.Model.RandomForestClassifier
- Hanalyze.Model.Regularized
- Hanalyze.Model.RegularizedAdvanced
- Hanalyze.Model.Reliability
- Hanalyze.Model.ReliabilityBlockDiagram
- Hanalyze.Model.Robust
- Hanalyze.Model.SVM
- Hanalyze.Model.Spline
- Hanalyze.Model.StateSpace
- Hanalyze.Model.Survival
- Hanalyze.Model.TimeSeries
- Hanalyze.Model.VAR
- Hanalyze.Model.Weibull
- Hanalyze.Model.Wrappers
- Optim
- Hanalyze.Optim.Acquisition
- Hanalyze.Optim.Adam
- Hanalyze.Optim.BayesOpt
- Hanalyze.Optim.CMAES
- Hanalyze.Optim.CMAESFull
- Hanalyze.Optim.Common
- Hanalyze.Optim.Constrained
- Hanalyze.Optim.Desirability
- Hanalyze.Optim.DifferentialEvolution
- Hanalyze.Optim.GradAscent
- Hanalyze.Optim.LBFGS
- Hanalyze.Optim.LineSearch
- Hanalyze.Optim.NSGA
- Hanalyze.Optim.NelderMead
- Hanalyze.Optim.Numeric
- Hanalyze.Optim.Pareto
- Hanalyze.Optim.ParticleSwarm
- Hanalyze.Optim.SimulatedAnnealing
- Stat
- Hanalyze.Stat.AD
- Hanalyze.Stat.AdaptiveGrid
- Hanalyze.Stat.BayesFactor
- Hanalyze.Stat.BayesianModelAveraging
- Hanalyze.Stat.Bootstrap
- Hanalyze.Stat.BridgeSampling
- Hanalyze.Stat.CV
- Causal
- Hanalyze.Stat.Causal.CATE
- Hanalyze.Stat.Causal.DoublyRobust
- Hanalyze.Stat.Causal.IPW
- Hanalyze.Stat.Causal.PropensityScore
- Hanalyze.Stat.Cholesky
- Hanalyze.Stat.ClassMetrics
- Hanalyze.Stat.CorrelationNetwork
- Hanalyze.Stat.Descriptive
- Hanalyze.Stat.Distribution
- Hanalyze.Stat.Effect
- Hanalyze.Stat.GroupComparison
- Hanalyze.Stat.Interpolate
- Hanalyze.Stat.Interpret
- Hanalyze.Stat.KernelDist
- Hanalyze.Stat.MCMC
- Hanalyze.Stat.MDS
- Hanalyze.Stat.ModelSelect
- Hanalyze.Stat.MultipleTesting
- Hanalyze.Stat.NumberFormat
- Hanalyze.Stat.PosteriorPredictive
- Hanalyze.Stat.QuasiRandom
- Hanalyze.Stat.SPC
- Hanalyze.Stat.Standardize
- Hanalyze.Stat.Summary
- Hanalyze.Stat.Test
- Hanalyze.Stat.VI
- Viz
- Hanalyze.Viz.AnalysisReport
- Hanalyze.Viz.Assets
- Hanalyze.Viz.Bar
- Hanalyze.Viz.Core
- Hanalyze.Viz.GP
- Hanalyze.Viz.GPReport
- Hanalyze.Viz.Histogram
- Hanalyze.Viz.MCMC
- Hanalyze.Viz.ModelGraph
- Hanalyze.Viz.ModelGraphDot
- Hanalyze.Viz.Pareto
- Hanalyze.Viz.PlotConfig
- Hanalyze.Viz.PlotData
- Hanalyze.Viz.PlotData.DataFrame
- Hanalyze.Viz.Report
- Hanalyze.Viz.ReportBuilder
- Hanalyze.Viz.ReportInstances
- Hanalyze.Viz.Scatter
- Hanalyze.Viz.Taguchi
- Data
Downloads
- hanalyze-0.2.0.1.tar.gz [browse] (Cabal source package)
- Package description (as included in the package)
Maintainer's Corner
For package maintainers and hackage trustees
Candidates
- No Candidates
| Versions [RSS] | 0.1.0.0, 0.1.0.1, 0.2.0.0, 0.2.0.1 |
|---|---|
| Change log | CHANGELOG.md |
| Dependencies | base (>=4.14 && <5), containers (>=0.6 && <0.8), dataframe-core (>=1.1 && <1.2), hanalyze-bayes (==0.2.0.1), hanalyze-core (==0.2.0.1), hanalyze-design (==0.2.0.1), hanalyze-frame (==0.2.0.1), hanalyze-models (==0.2.0.1), hanalyze-viz (==0.2.0.1), hmatrix (>=0.20 && <0.22), mwc-random (>=0.15 && <0.16), statistics (>=0.16 && <0.17), text (>=1.2 && <2.2), vector (>=0.12 && <0.14) [details] |
| Tested with | ghc ==9.6.7 |
| License | BSD-3-Clause |
| Copyright | 2026 Aelysce Project (Toshiaki Honda) |
| Author | Toshiaki Honda |
| Maintainer | frenzieddoll@gmail.com |
| Uploaded | by frenzieddoll at 2026-08-13T05:54:49Z |
| Category | Math, Statistics, Numeric, Machine Learning |
| Home page | https://github.com/frenzieddoll/hanalyze |
| Bug tracker | https://github.com/frenzieddoll/hanalyze/issues |
| Source repo | head: git clone https://github.com/frenzieddoll/hanalyze.git |
| Distributions | |
| Reverse Dependencies | 2 direct, 0 indirect [details] |
| Downloads | 70 total (17 in the last 30 days) |
| Rating | (no votes yet) [estimated by Bayesian average] |
| Your Rating | |
| Status | Docs available [build log] Last success reported on 2026-08-13 [all 1 reports] |
Readme for hanalyze-0.2.0.1
[back to package description]hanalyze
🌐 English | 日本語


hanalyze is a Haskell-native statistical engineering toolkit: regression, GLMM, Bayesian inference (HMC/NUTS/Gibbs/ADVI/SMC), Gaussian processes, machine learning (SVM / gradient boosting / neural networks), survival analysis (KM / Cox / AFT / competing risks), time series (ARIMA / GARCH / state space), causal discovery (LiNGAM) and treatment-effect estimation, design of experiments (classical + custom optimal design), multi-objective optimisation, native plotting, and HTML reporting integrated under one API. Core modelling and optimisation logic is implemented in Haskell, with numerical linear algebra delegated to hmatrix/BLAS/LAPACK. No R/Stan/Python bridge required. Benchmarks (see below) show competitive accuracy with Python/R references in the tested cases. Performance varies by domain: optimisation and small-to-medium MCMC workloads are often faster in these benchmarks, while large-scale ML/GLM workloads are currently slower than sklearn.
Highlights
- Haskell-native: types catch many dtype/API mismatches; shape checks happen at runtime where needed
- Algorithms in Haskell, BLAS for numerics: hmatrix/BLAS/LAPACK powers linear algebra; no R/Stan/Python bridge
- Native plotting: 90+ documented figure types through the hgg grammar-of-graphics integration (separate
hanalyze-plotpackage, build withcabal build --project-file=cabal.project.plot) — pure-Haskell SVG output, no browser required (see Gallery) - HTML reporting: MathJax/Mermaid + Vega-Lite visualisations in one call; PNG/SVG export available for supported plots
- Dirty-data defence: 8 warning codes + auto-sniff (delim/header/encoding) + cleaning DSL
- Hackage
dataframe: Polars-like DataFrame used directly; CSV native, Parquet/JSON support throughdataframe
Gallery
Every figure below (and 90+ more across docs/) is generated straight
from analysis results via the hgg integration — pure Haskell, SVG out.
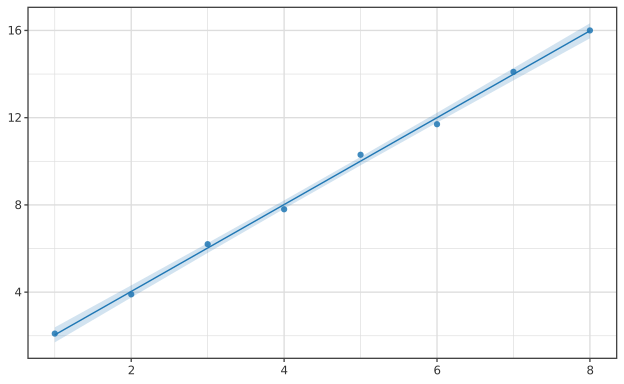 Linear regression — fit + 95% CI (docs) |
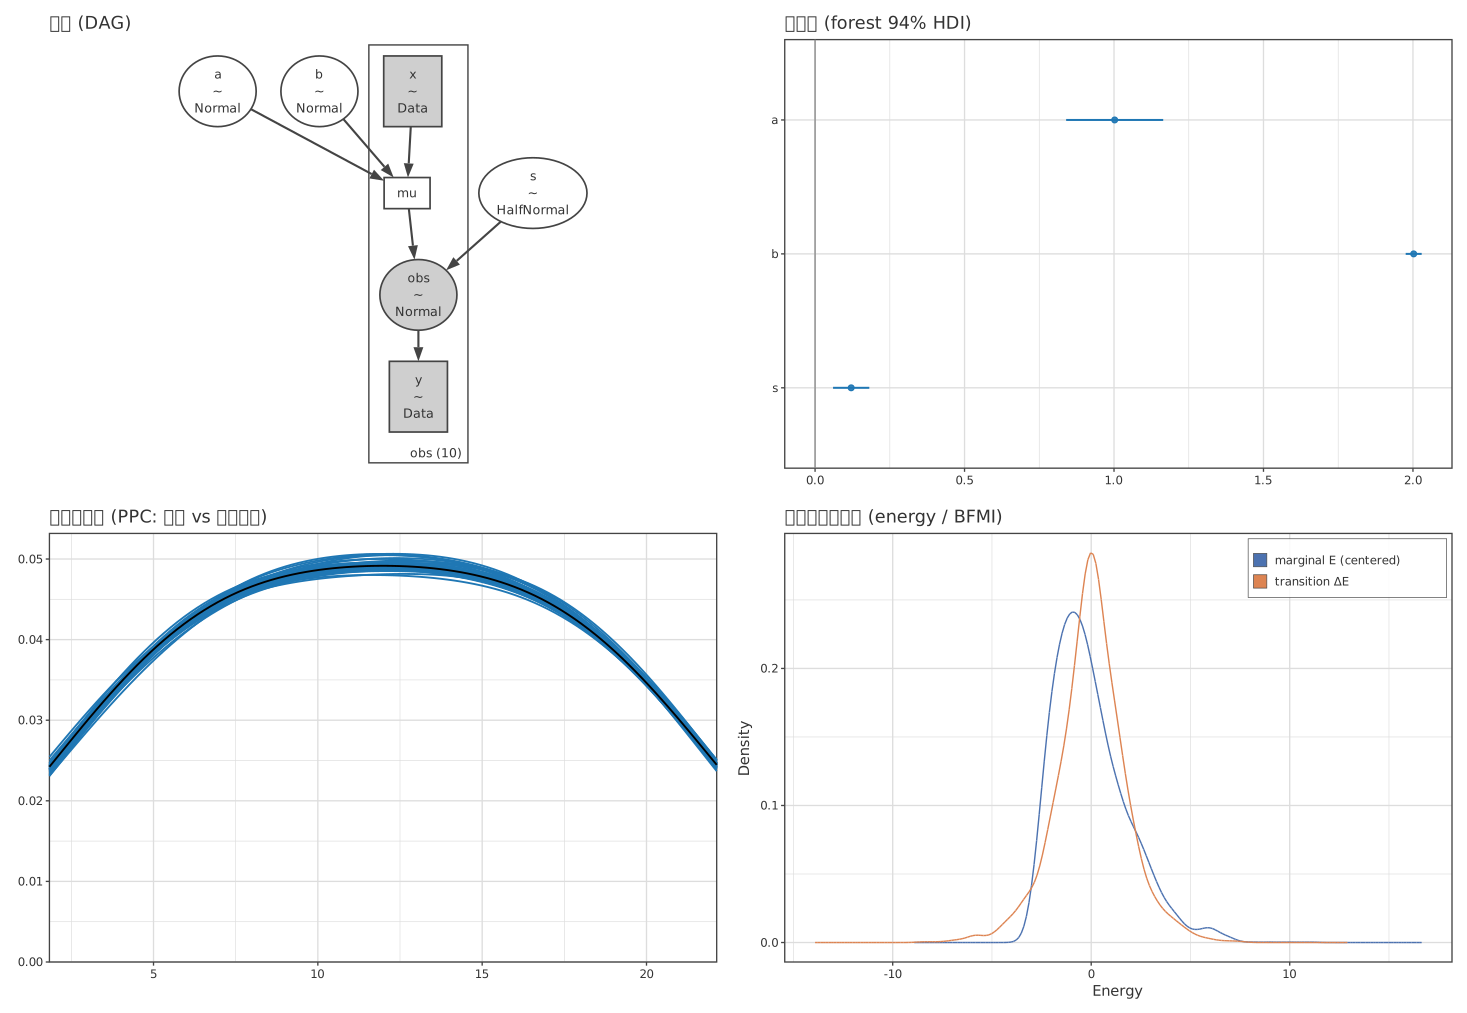 Bayesian MCMC dashboard — trace / density / R̂ / ESS (docs) |
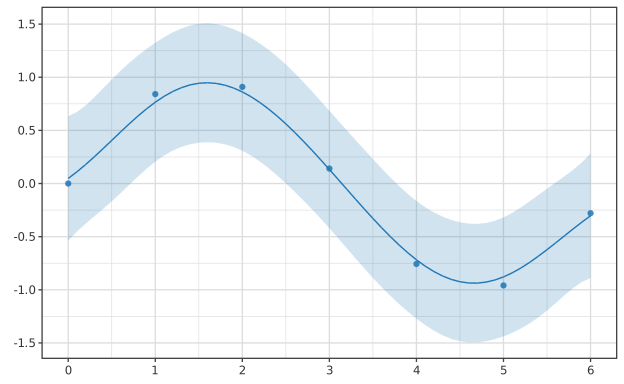 Gaussian process — mean + credible band (docs) |
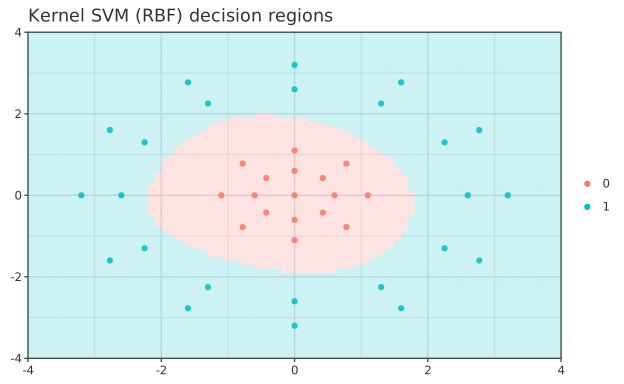 Kernel SVM (RBF) — decision boundary + support vectors (docs) |
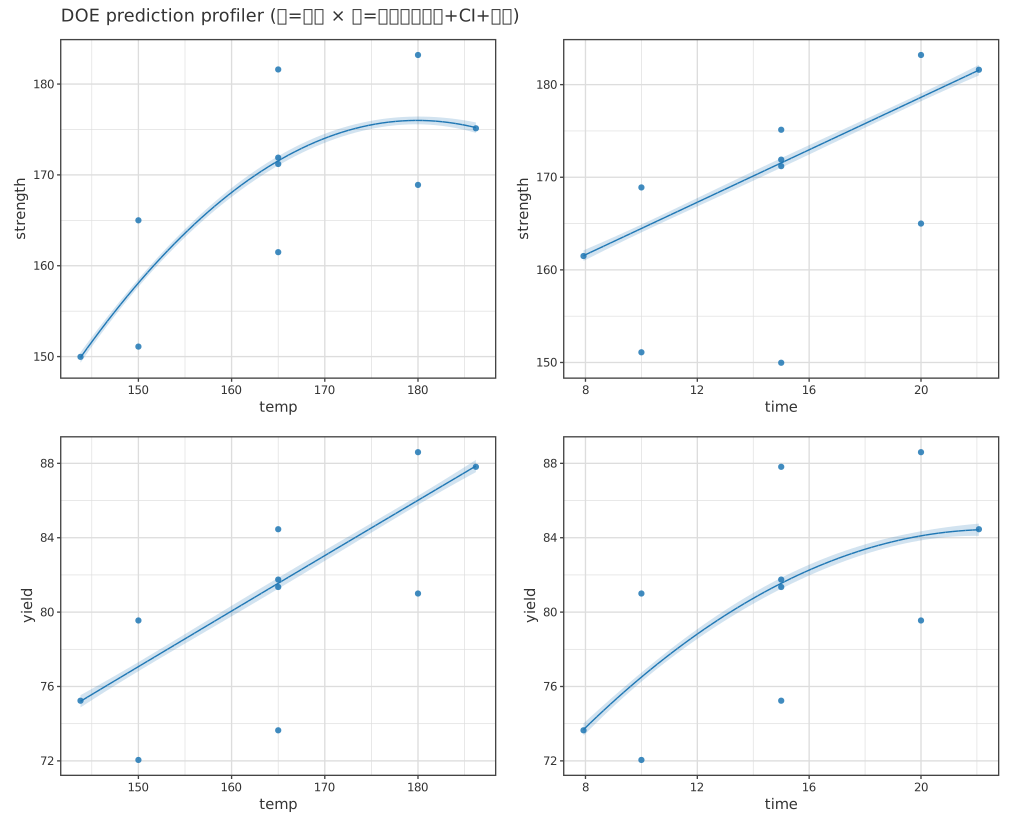 DOE prediction profiler — response vs each factor + CI (docs) |
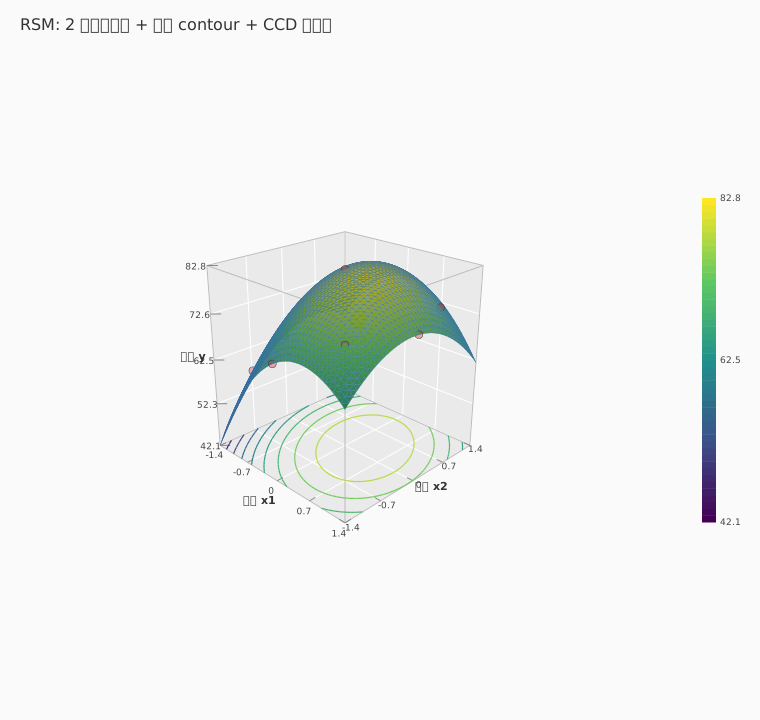 RSM response surface (3D) (docs) |
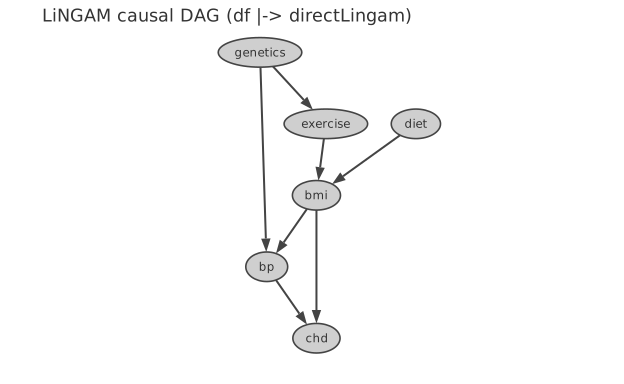 DirectLiNGAM causal discovery — estimated DAG (docs) |
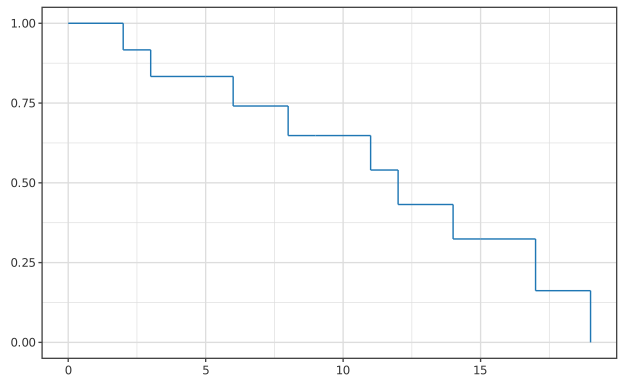 Kaplan-Meier survival curves (docs) |
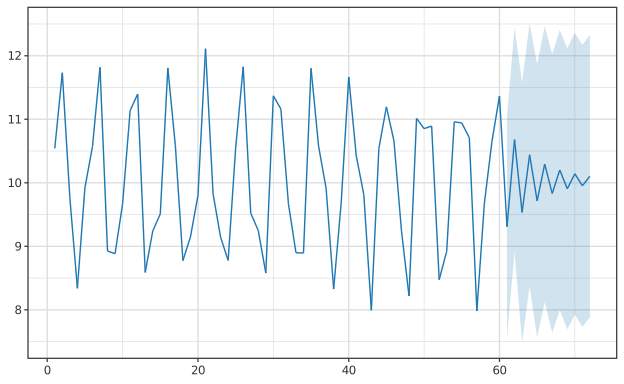 Time-series forecast (docs) |
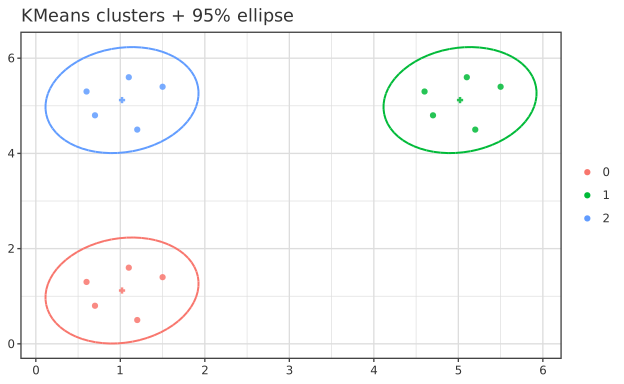 k-means clusters + 95% ellipses (docs) |
Capabilities
Features are organised by topic, with the details delegated to the per-topic docs and
the package READMEs. The full index is docs/README.md; the
exhaustive API dictionary is docs/api-guide/ (12 chapters).
| Topic | Main items | Guide | API |
|---|---|---|---|
| Statistical inference | 12 hypothesis tests, multiple-comparison correction, bootstrap CI, effect size + power, cross-validation | stat/ | 10 stat |
| Regression | LM / GLM / GLMM / robust / quantile / penalized (ridge…SCAD) / spline / GAM / GP / RFF | regression/ | 02 regression |
| Machine learning | Random forest / GBM / decision tree / k-NN / naive Bayes / SVM / MLP / MDS / PDP and ICE | ml/ | 05 ml |
| Multivariate | PCA / PLS / RRR / CCA / discriminant analysis / clustering / FDA | fda/ | 04 multivariate |
| Causal | Propensity score / IPW / DR / CATE / all 7 LiNGAM variants | causal/ | 08 causal |
| Bayesian | HBM DSL (plates, hierarchy) / MH, HMC, NUTS, Gibbs, ADVI / convergence diagnostics / posterior predictive | bayesian/ | 03 bayesian-hbm |
| Time series & survival | AR / VAR / GARCH / Kalman / Kaplan-Meier / competing risks / AFT / Cox | timeseries/ | 06 / 07 |
| Optimization | Nelder-Mead / L-BFGS / DE / CMA-ES / NSGA-II / Bayesian optimization / augmented Lagrangian | optim/ | — |
| Design of experiments | Factorial / RSM / D-, A-, I-, G-optimal / orthogonal arrays / Taguchi / custom design / power | doe/ | 09 doe |
| Data I/O | CSV / Parquet / JSON loading, cleaning, reshaping (Data.Transform / Data.Wrangle) |
io/ | 11 data |
| Visualization | Vega-Lite based charts, integrated HTML reports, HBM DAG rendering | visualization/ | 12 plot |
One entry point: every model is fitted with df |-> spec and drawn with toPlot.
The plotting integration lives in a separate package, hanalyze-plot
(cabal build --project-file=cabal.project.plot).
Version compatibility with the plotting ecosystem:
| hgg | hanalyze | integration packages |
|---|---|---|
| 0.2.x | 0.2.0.1+ | hanalyze-plot 0.2.0.1 (analyze → plot) / hgg-analyze-bridge 0.2 (plot → analyze) |
Installation
Requirements
| Item | Requirement |
|---|---|
| GHC | 9.6.7 (the tested-with of every package) |
| cabal | 3.14.2 or newer (verified with 3.16.1) |
| BLAS / LAPACK | Required by hmatrix (Debian/Ubuntu: libblas-dev liblapack-dev gfortran / Arch: blas lapack gcc-fortran). For OpenBLAS use --constraint='hmatrix +openblas' |
| Graphviz | Optional; only to rasterize the DOT output of ModelGraphDot |
Using it as a library
This repository is a 10-package multi-package project and is not published as a
package yet. Clone it and list the packages in your own cabal.project.
git clone https://github.com/frenzieddoll/hanalyze
-- cabal.project
packages: .
          ./hanalyze/hanalyze
          ./hanalyze/hanalyze-core
          ./hanalyze/hanalyze-frame
          ./hanalyze/hanalyze-bayes
          ./hanalyze/hanalyze-models
          ./hanalyze/hanalyze-design
          ./hanalyze/hanalyze-viz
For build-depends, hanalyze alone is the default answer (module names do
not change across layers). Name a layer directly only when you want to narrow the
dependency. Each package has a README with a module map and a standalone example.
| Package | Role |
|---|---|
hanalyze |
Umbrella re-exporting every layer (use this unless you have a reason not to) |
-core |
Descriptive statistics, tests, optimization, numerical core |
-frame |
DataFrame integration, loading, reshaping, the fit API |
-models |
Regression, machine learning, time series, survival, causal |
-bayes |
MCMC and HBM |
-design |
Design of experiments |
-viz |
Vega-Lite visualization and HTML reports |
-plot |
hgg integration (toPlot); separate build root |
-cli |
The hanalyze command |
-demos |
Demo and benchmark executables |
Opt-in build roots
The default cabal.project is plot-independent; switch roots as needed.
| Build root | Contents |
|---|---|
cabal.project (default) |
Library + tests (no plot dependency) |
cabal.project.plot |
The above + hanalyze-plot (requires the sibling hgg) |
cabal.project.demos |
The above + the demo / benchmark executables |
Just the CLI
cabal install hanalyze-cli # installs the hanalyze command
Quick start
30 seconds via CLI
git clone https://github.com/frenzieddoll/hanalyze
cd hanalyze

# Regress sales on price + promo, write an HTML report.
cabal run hanalyze -- regress data/readme/sales.csv "price promo" sales --report sales.html
# β₀=185.05  β(price)=-4.37  β(promo)=+32.29  R²=0.995
data/readme/sales.csv is a 20-row demo CSV shipped with the repository
(price, promo, sales). The generated sales.html includes coefficients,
fit diagnostics, and an interactive prediction widget — straight from one
command.
30 seconds via Haskell API
import qualified Hanalyze.Stat.Test as ST
import qualified Numeric.LinearAlgebra as LA

main = do
  let xs = LA.fromList [12, 14, 13, 15, 17, 11]
      ys = LA.fromList [18, 22, 20, 19, 25, 17]
      result = ST.tTestWelch xs ys ST.TwoSided
  print (ST.trPValue result, ST.trEffect result)
  -- (1.688e-3, Just ("Cohen's d", -2.527))
A single import Hanalyze re-exports the core entry points (linear / GLM models,
descriptive stats, tests, effect sizes, distributions, plotting helpers and CSV
I/O) for quick exploration; reach for the individual Hanalyze.Model.* /
Hanalyze.Stat.* modules when you need their full surface.
See docs/01-quickstart.md for a fuller introduction.
CLI
hanalyze help                     list subcommands
hanalyze regress <file> <x> <y>   LM/GLM/GP/HBM regression + HTML report
hanalyze info <file>              per-column type/statistics
hanalyze hist <file> <col>        histogram with theoretical PDF overlay
hanalyze ridge <file> ...         regularised regression (Ridge/Lasso/EN)
hanalyze kernel <file> ...        kernel regression (NW/KR/RFF), multi-D inputs
hanalyze spline <file> ...        spline regression
hanalyze multireg <file> ...      multi-output regression + interactive HTML
hanalyze melt <file> ...          long-form transform
hanalyze regrid <file> ...        time-axis grid alignment
hanalyze doe ortho <NAME> -f ...  orthogonal-array generation
hanalyze taguchi sn / analyze     Taguchi method
hanalyze clean <file> --rule ...  dirty-data cleaning
For per-command flags, run hanalyze <cmd> --help or see docs/01-quickstart.md.
Examples / demos
hanalyze-demos/demo/ contains many demos (76 as of this release). Highlights:
| Demo | Summary |
|---|---|
hanalyze-demos/demo/regression/HBMRegressionDemo.hs |
HBM Bayesian linear regression with NUTS + HTML |
hanalyze-demos/demo/regression/RFFDemo.hs |
Large-scale GP via Random Fourier Features |
hanalyze-demos/demo/regression/RobustGPDemo.hs |
Robust GP with Student-t observation likelihood |
hanalyze-demos/demo/doe-optim/NSGADemo.hs |
NSGA-II + Pareto on the ZDT suite |
hanalyze-demos/demo/doe-optim/BayesOptDemo.hs |
BO on Branin / Hartmann6 |
hanalyze-demos/demo/bayesian/HBMComparisonDemo.hs |
Compare HBMs with WAIC / LOO |
hanalyze-demos/demo/bayesian/SimpsonParadoxDemo.hs |
Disentangle Simpson's paradox via hierarchical model |
hanalyze-demos/demo/io/DirtyDataDemo.hs |
Auto-defend against 19 dirty CSV variants |
Run: dist-newstyle/build/x86_64-linux/ghc-9.6.7/hanalyze-demos-0.2.0.1/x/<demo-name>/build/<demo-name>/<demo-name>.
Where hanalyze fits
Rather than a complete Python/R replacement, hanalyze targets specific workflows where Haskell integration, single-binary CLI, and tight reporting add value.
Strong fit
- Haskell-native pipelines that need stats/Bayes/optim without calling out to Python
- Single-binary CLI distribution (one
hanalyzebinary, no Python venv) - Dirty-CSV defence + cleaning + analysis in one workflow
- DoE / Taguchi / orthogonal arrays for manufacturing and process tuning
- HTML reports straight from the analysis (no separate templating step)
- Type-safe analysis pipelines that catch dtype/API mismatches early
Not a goal — keep using existing tools for
- Large-scale DataFrame work (pandas / polars / data.table)
- GPU deep learning (PyTorch / JAX)
- The full breadth of scikit-learn's mature model zoo
- The full Stan / PyMC MCMC diagnostics ecosystem
- The full expressive range of ggplot2
Comparison vs Python
R is included in the feature map only — no numerical bench against R has been run.
Numbers below come from bench/results/{haskell,python}/*.csv; see
bench/results/SUMMARY.md for the full table and
benchmark conditions (OPENBLAS_NUM_THREADS=1 OMP_NUM_THREADS=1,
single-thread, deterministic seeds).
| Domain | Result in these benchmarks |
|---|---|
| Single-objective optim (DE/CMAES/L-BFGS/NM) | Often faster than scipy in tested cases (Rosenbrock_2D/DE 134×, Ackley/CMAES 49×, Griewank/CMAES 54×). On Sphere_30D/L-BFGS the reported objective value is 8.1e-40 vs scipy 2.6e-11 in this run. |
| Multi-objective optim (NSGA-II) | Comparable or favourable in the ZDT/DTLZ suite (DTLZ2_3 1.43× faster, ZDT1/2/3 within ±5% of pymoo). HV/IGD figures match or slightly improve on pymoo in these runs. |
| Bayesian optim (BO) | Comparable on Branin (1.15×); on Hartmann6 the best objective in this run was -3.07 vs skopt -2.77. |
| Simulated annealing (Tsallis SA) | Comparable; Rastrigin_10D reaches 0.0 in this run (scipy dual_annealing reports 7.8e-14). |
| Classical regression (LM/Ridge/Lasso/GLMM) | Comparable in tested cases; LME 30× faster than statsmodels in our LME run. |
| Large-scale GLM/Lasso (n ≥ 10k) | Currently slower than sklearn (3-5× in tested cases) — sklearn's Cython inner loops dominate. |
| Kernel/GP | Currently slower than sklearn (2.5-4.7× in tested cases). |
| Bayesian MCMC (NUTS/HMC) | NUTS with ESS comparable to blackjax (mu: 839 vs 810) on the 8-schools benchmark; 7.4× faster than PyMC; 2.8× slower than blackjax (JAX-JIT advantage). |
| HBM (probabilistic programming) | Polymorphic DSL with selected PyMC-style modelling features and selected distributions (Truncated/Censored/MvNormal/LKJ/...). |
| VI / WAIC / LOO | ADVI 3.0× faster than numpyro SVI on a small logistic posterior; LOO 2.9× faster than arviz on (S=1000, N=200) log-lik matrix. |
| Hypothesis tests / bootstrap / k-fold | Welch t-test 39× faster, KS 11×, k-fold split 2.2× faster than scipy/sklearn in tested cases. |
| Time series / Spline / GAM | ARIMA 128× faster than statsmodels; Spline PCHIP comparable to scipy; GAM ~1.6× slower than pygam in tested cases. |
| Survival analysis (KM/Cox PH) | Comparable to lifelines in tested cases (KM/CoxPH). |
| Multi-output regression / Regrid | MultiLM 2.3× faster than sklearn; regridLong 20× faster than a hand-written pandas+scipy synthesis. |
| Visualisation | Vega-Lite specs via hvega (grammar-of-graphics-style); HTML reports built-in. |
See docs/comparison/python-r.md for the feature map, and bench/results/SUMMARY.md for numbers.
Benchmark highlights
Selected results from bench/results/SUMMARY.md. Each entry is a single
benchmark configuration; absolute objective values depend on iteration
counts, seeds, and tolerances — see the SUMMARY for full conditions.
NUTS is additionally validated against posteriordb reference posteriors
(see bench/posteriordb/).
- NUTS 8-schools (warmup 500, samples 1000): hanalyze 1492 ms with ESS(mu) 839 vs blackjax 530 ms / ESS 810 in this run
- Holt-Winters seasonal n=500 p=12: hanalyze 0.19 ms vs statsmodels MLE 96 ms in this run (note: hanalyze uses fixed α=0.3 closed-form; statsmodels does MLE)
- Sphere_30D/DE: hanalyze 1.0e-26 vs scipy 2.8e-5 on this benchmark
- Sphere_30D/L-BFGS: hanalyze 8.1e-40 vs scipy 2.6e-11 on this benchmark
- Rastrigin_10D/SA: hanalyze 0.0 vs scipy
dual_annealing7.8e-14 in this run - Hartmann6/BO: hanalyze -3.07 vs skopt -2.77 in this run
- DTLZ2_3/NSGA-II: hanalyze 528 ms vs pymoo 758 ms (1.43× faster in this run)
- DE Rosenbrock_2D: hanalyze 1.2 ms vs scipy 164 ms (134× faster in this run)
- Constrained Quad2D (eq): hanalyze 0.062 ms vs scipy SLSQP 0.69 ms in this run
- regridLong on jagged long-form: hanalyze 0.99 ms vs pandas+scipy synthesis 19.4 ms in this run
Reproduce: OPENBLAS_NUM_THREADS=1 OMP_NUM_THREADS=1 cabal run bench-{regression,kernel,optim,mo,bo,mcmc-b7,mcmc-extras,ts-extras,optim-plus,stat-util,multi-output,regrid}, then bench/python/bench_*.py (see bench/README.md).
Architecture
graph TD
  IO[DataIO.* CSV/Parquet/JSON]
  IO --> DF[Hackage dataframe]
  DF --> Models[Model.* regression/ML/Bayesian/TS/Survival]
  DF --> Stat[Stat.* tests/CV/effect/interpret]
  Models --> Optim[Optim.* optimisation]
  Models --> MCMC[MCMC.* samplers]
  Models --> Viz[Viz.* HTML/PNG/SVG]
  Stat --> Viz
  MCMC --> Viz
  Optim --> Design[Design.* DoE/Taguchi]
All modules talk to Hackage dataframe directly. The internal DataFrame.Core was retired.
Roadmap & API stability
- Stable (API expected to remain backward-compatible within minor versions):
Hanalyze.DataIO.*,Hanalyze.Stat.{Test, Bootstrap, MultipleTesting, ClassMetrics, CV, Effect, Distribution},Hanalyze.Model.{LM, GLM, Spline, Regularized, RandomForest, DecisionTree, TimeSeries, Survival, GAM},Hanalyze.Optim.{NelderMead, LBFGS, DifferentialEvolution, CMAES, NSGA, BayesOpt, SimulatedAnnealing, ParticleSwarm},Hanalyze.Design.*,Hanalyze.Viz.{Scatter, Bar, Histogram}. - Experimental (API may evolve):
Hanalyze.Model.HBMDSL,Hanalyze.MCMC.NUTS(mass-matrix adaptation is opt-in),Hanalyze.Stat.VI(ADVI),Hanalyze.Model.{GP, RFF, GPRobust, GLMM},Hanalyze.Model.{SVM, GradientBoosting, NeuralNetwork},Hanalyze.Model.LiNGAM.*,Hanalyze.Design.Custom.*, thedf |-> specfit operator (Hanalyze.Fit), the hgg integration (cabal.project.plotbuild root),Hanalyze.Viz.ReportBuilder. Behaviour is benchmarked but type signatures may shift. - Future direction: a backend-abstraction typeclass for swapping hmatrix/Massiv/Accelerate is under consideration but not on a fixed schedule. (The unified top-level re-export layer and the fit-operator API planned earlier landed in 0.2.0.0 as
module HanalyzeandHanalyze.Fit.)
Module layout
Multi-package since Phase 106 (2026-07-19). The umbrella package hanalyze
re-exports every module under its original name, so downstream imports are unchanged.
Packages sit flat at the repo root and the root itself is a pure workspace
(cabal.project only, no root package) — the conventional layout for Haskell
library monorepos (cabal, plutus).
hanalyze/         — umbrella: Fit/Wrappers/Diagnostics/Analyze + re-exports, test suite
hanalyze-core/    — Math kernels, low-level Stat, Optim, MCMC.Core, Model.Core (44 mods)
hanalyze-frame/   — Data/ + DataIO/ (CSV/JSON/Parquet IO, clean DSL, reshape) (14 mods)
hanalyze-bayes/   — HBM DSL/IR + MCMC samplers (MH/HMC/NUTS/Gibbs/Slice/SMC) + VI (26 mods)
hanalyze-models/  — LM/GLM/GLMM/GP/SVM/GBM/NN/Cluster/TS/Survival/LiNGAM/FDA etc. (67 mods)
hanalyze-design/  — Factorial/Block/RSM/Orthogonal/Taguchi + Custom optimal design (30 mods)
hanalyze-viz/     — Vega-Lite-based visualisation + ReportBuilder (19 mods)
hanalyze-plot/    — hgg integration (cabal.project.plot root only) (8 mods)
hanalyze-cli/     — the `hanalyze` CLI executable
hanalyze-demos/   — hanalyze-demos/demo/posteriordb executables (cabal.project.demos root only)
As of this release: 212 modules, ~1,390 test examples.
Build
cabal build all                  # umbrella library + CLI + test suite
cabal test all                   # hspec test suite
cabal repl hanalyze       # interactive REPL (umbrella)
Build roots: default cabal.project (standalone, no plot), cabal.project.plot
(+ hgg integration), cabal.project.demos (+ hanalyze-demos/demo/posteriordb executables).
See CONTRIBUTING for the full table.
Major dependencies: hmatrix (BLAS/LAPACK), hvega (Vega-Lite), statistics, mwc-random, dataframe (Hackage Polars-like), massiv (parallel arrays), ad (auto-diff), async.
Tested on GHC 9.6.7 + cabal 3.14.2.
Running benchmarks
# 1. Generate shared test data (fixed-seed, deterministic)
#    The benchmark executables live in the demos package, so pass that build root
cabal run --project-file=cabal.project.demos bench-data-gen

# 2. Haskell side
OPENBLAS_NUM_THREADS=1 OMP_NUM_THREADS=1 \
  cabal run --project-file=cabal.project.demos \\
    bench-regression bench-kernel bench-optim bench-mo bench-bo

# 3. Python side (need bench/venv from bench/requirements.txt)
OPENBLAS_NUM_THREADS=1 OMP_NUM_THREADS=1 \
  bench/venv/bin/python bench/python/bench_regression.py
# (similarly for kernel, optim, mo, bo)

# 4. Aggregate (Markdown table)
bench/venv/bin/python bench/aggregate.py > bench/results/SUMMARY.md
Development
- Issues / PRs: github.com/frenzieddoll/hanalyze
- Adding tests: append hspec specs in
test/Spec.hs - Adding benchmarks: place
hanalyze-demos/bench/haskell/Bench*.hsand matching Python script - Coding rules: see
CONTRIBUTING.md(no list-passing on hot paths, minimiseunsafe*, ...)
License
BSD-3-Clause License — see LICENSE.
Author
Toshiaki Honda frenzieddoll@gmail.com