| Safe Haskell | Safe-Inferred |
|---|---|
| Language | Haskell2010 |
Core.Telemetry.Honeycomb
Description
A exporter backend that sends telemetry in the form of traces of your application's behaviour, or event data—accompanied either way by [conceivably very wide] additional metadata—to the Honeycomb observability service.
When specifying the honeycombExporter you have to specify certain
command-line options and environment variables to enable it:
$ export HONEYCOMB_TEAM="62e3626a2cc34475adef4d799eca0407"
$ burger-service --telemetry=honeycomb --dataset=prod-restaurant-001
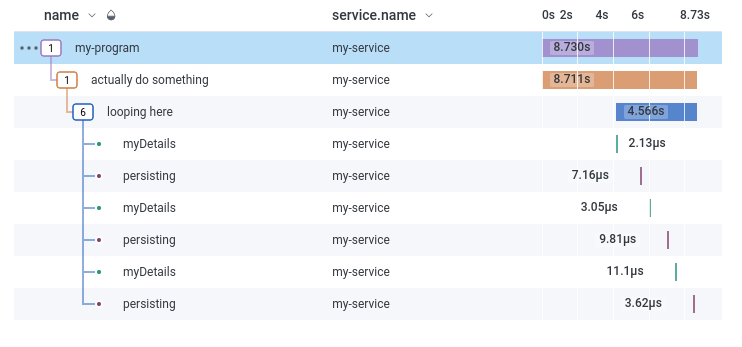
If you annotate your program with spans, you can get a trace like this:

This library by default will upload telemetry information to the default Honeycomb endpoint at 'api.honeycomb.io'. However, it also offers support for intermediate services (such as Honeycomb Refinery) when specifying a host explicitly, such as:
$ export HONEYCOMB_HOST=my-intermediate-service.internal
The library still assumes that the service is running on port 443 and behind SSL.
More details on Refinery: https://docs.honeycomb.io/manage-data-volume/refinery/
Notice
This library is Open Source but the Honeycomb service is not. Honeycomb offers a free tier which is quite suitable for individual use and small local applications. In the future you may be able to look at Core.Telemetry.General if you instead want to forward to a generic OpenTelemetry provider.
Gotchas
Spans are sent to Honeycomb as they are closed. Hence, if you have a long lived span, while its child spans are sent to Honeycomb and are displayed, the parent span will be initially missing.

This is of course jarring, because the parent is defined in the code before
the section where the child is called. So when writing long lived services, it
is best to call beginTrace inside a function
that will iterate continuously. That way complete telemetry will be generated
for that part of the code, making on-the-fly diagnosis and monitoring
possible.
Either way, when the parent span is closed, unless the process is killed, the full trace will be visible.

Synopsis
- type Dataset = Rope
- honeycombExporter :: Exporter
- setDatasetName :: Dataset -> Program τ ()
Documentation
honeycombExporter :: Exporter Source #
Configure your application to send telemetry in the form of spans and traces to the Honeycomb observability service.
context <-configure... context' <-initializeTelemetry[honeycombExporter] contextexecuteWithcontext' ...
setDatasetName :: Dataset -> Program τ () Source #
Override the dataset being used for telemetry.
Under normal circumstances this shouldn't be necessary. The default dataset
for your program's telemetry is set by the infrastructure using the
--dataset= command-line option, and typically matches the single service
name set by setServiceName. For most applications this is sufficient. There
are, however, times when you need to send events or spans to a different
dataset. If there are two completely unrelated behaviours in a given
application that occur with wildly different latency ranges then you may
find it appropriate to segment the telemetry into two different datasets.
This override will be inherited by any spans that come into scope below the one where this is called.
Since: 0.2.9